870
Udemy Courses Dashboard 2
Udemy Courses Dashboard 2
Report Author: Rich Evans
870
Share template with others
Report submitted for Onyx Data DataDNA ZoomCharts Mini Challenge, January 2024. The report was built based on Udemy Courses dataset and includes ZoomCharts custom Drill Down PRO visuals for Power BI.
Author's description:
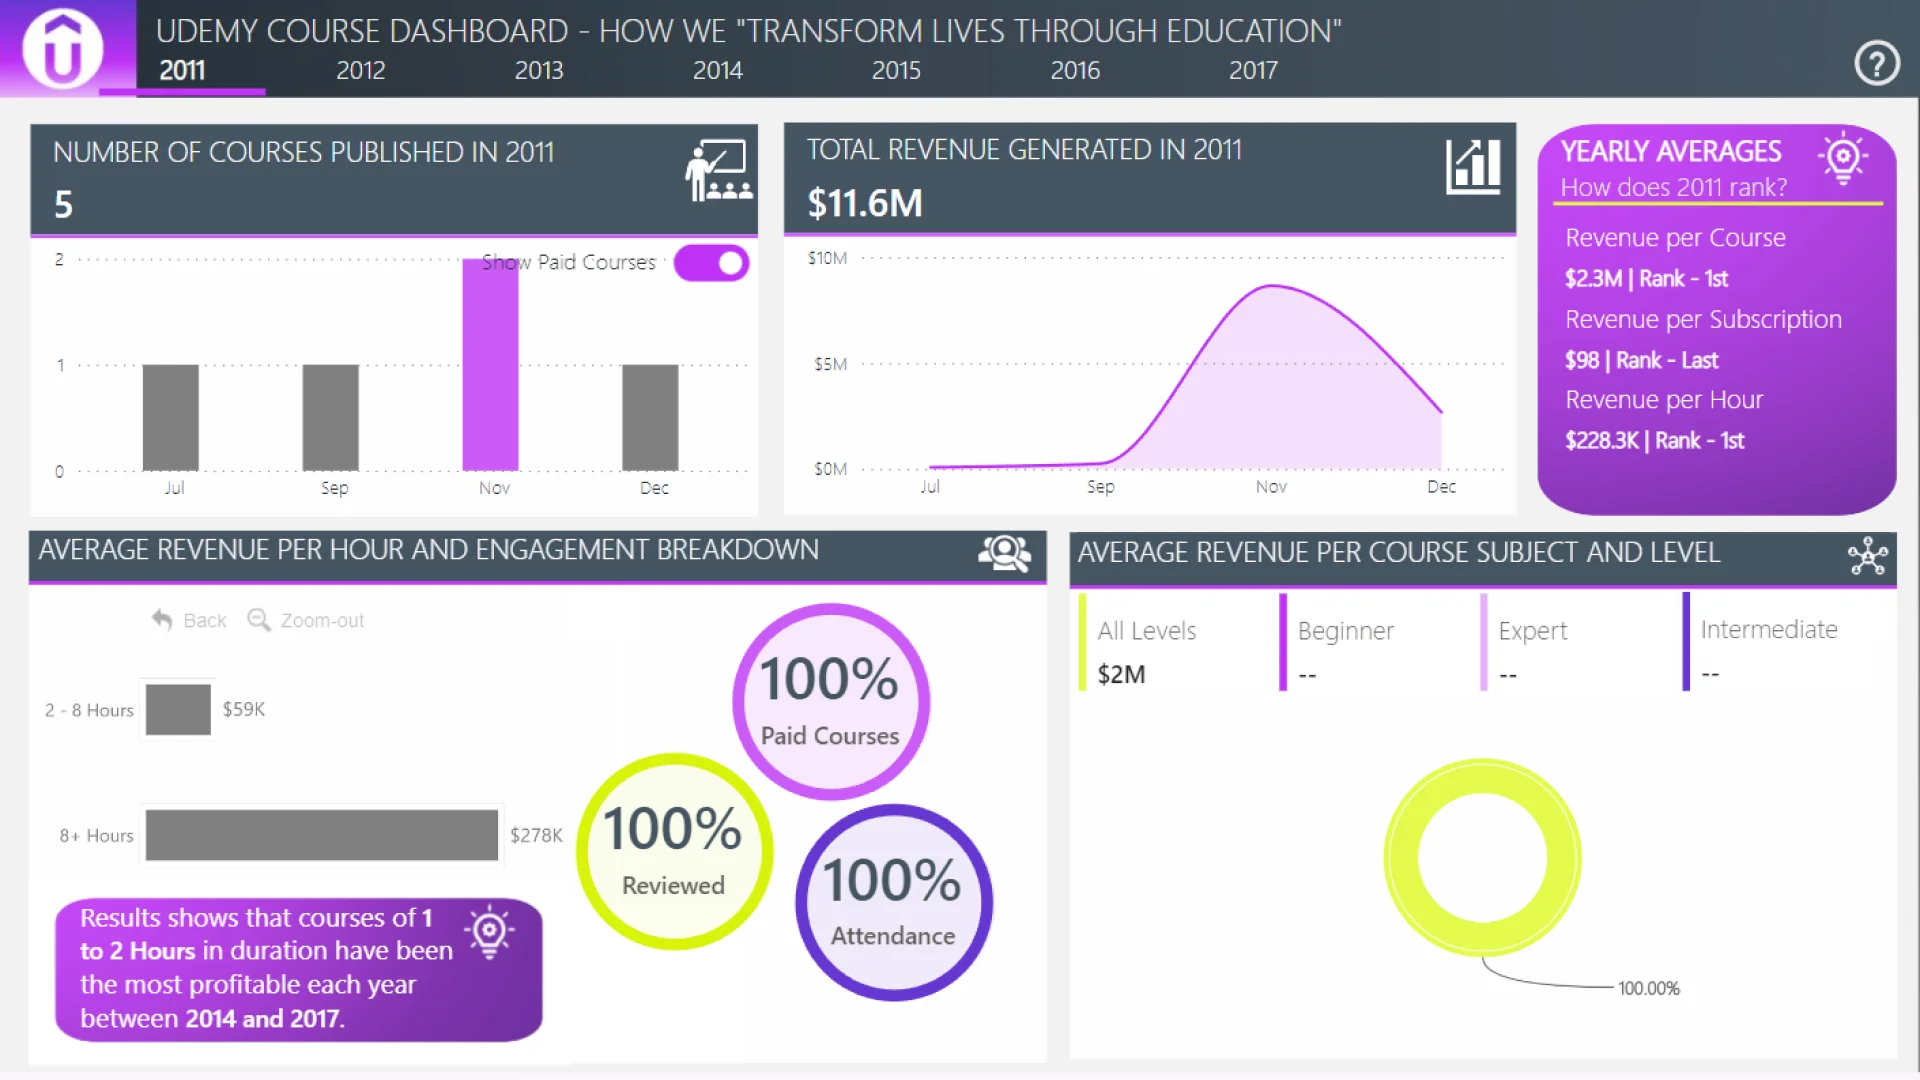
For this challenge I have created a power bi report using the Onyx dataset showcasing Udemy courses between 2011 and 2017. I've utalised key components from Udemy's own website, such as their colour theme and their slogan (used in the header of my report) to help shape the structure. Due to the date range of the data provided lacking consistency across all years, I decided it was best to have the report containing a single year by year filter. For example, in the dataset, 2011 starts in July, 2017 ends in July and the year span is half way between years over a 6 year period, not, for example a more rounded range like a full decade of data. However, I have included KPI rankings in the top right of the main overview page to detail how the selected year compares to other years in the dataset.
To provide meaningful comparisons, of which number of courses, revenue etc aren't due to the changing nature year on year of Udemy's popularity (where you'd expect number of courses, revenue, subscribers etc to increase anyway), I created more meaningful measures to use for comparison which reduce the meaning of a 12 month year vs a 6 month year. These include Average Revenue per duration in Hours, Average Revenue per course and Average Revenue per subscription, all aspects which won't necesserily increase as time goes on and thus give a better insight into where the most and least profitable criteria lie. Udemy can then compare these KPIs with varying instructor salaries over the years (and dependant on course level, subject and length) to better offset financial gain compared to outlay costs. Of course, for these to be fully representative of the data, free courses have been excluded from these calculations.
The report also consists of a drill through page, using a search filter for course titles, so that a user can, for example, type in Java and view the full range of Java courses, instead of having to search and select each one manually, as they would with a generic slicer. A waterfall chart accompanies the table to view a breakdown of the financial side of things. The data in this is presented showing the differentials of each year-on-year, which can be drilled through to month-on-month so that any large spells of increase/decrease in revenue are easily visible.
A help button is evident in the report to give the user an understanding of the report's purpose and how to use power bi's host of features such as tooltips and drill down/through.
I have used Zoom Chart's Drill Down Combo Bar to detail course duration grouped into meaningful categories, with 8+ hours used to detail courses that would usually last longer than a full working day.
I have also used Zoom chart's Drill Down Donut chart to slice and dynamically visualise the data between course level and subject. I would have utalised more zoom charts to detail the Number of courses published and the Total Revenue, but due to the coloured conditional formatting I wanted to showcase and the fact I wanted to have these as separate visuals as i'm not a fan of multiple y axis on a chart, I decided against using the drill down timeline.
4U Report Challenges
Participate in data challenges, build and submit reports to get free template downloads.
Join CommunityMobile view allows you to interact with the report. To Download the template please switch to desktop view.
Was this helpful? Thank you for your feedback!
Sorry about that.
How can we improve it?