logo
For Power BI
  • Products
    • Drill Down Donut Pro Drill Down Donut PRO
    • Drill Down Pie Pro Drill Down Pie PRO
    • Drill TimeSeries Pro Drill Down TimeSeries PRO
    • Drill Combo Pro Drill Down Combo PRO
    • Drill Map Pro Drill Down Map PRO
    • Drill Scatter Pro Drill Down Scatter PRO
    • Drill Down Network Pro Drill Down Network PRO
    • Drill Down Waterfall Pro Drill Down Waterfall PRO
    • Drill Down Graph Pro Drill Down Graph PRO
    • Drill Down Timeline Pro Drill Down Timeline PRO
    • Drill Down Combo Bar PRO Drill Down Combo Bar PRO

    Video tutorials

    Watch Now

    More than 90 videos on how to enhance Power BI with ZoomCharts

    Learn more
    All visuals
  • Resources

      Resources

    • Documentation
    • Report Examples
    • Blog
    • Webinars
    • Video Tutorials
    • Visuals Gallery

    Support

    • ZoomCharts Assistance
    • Contact Sales
    • Contact Support
    • FAQ

    Challenges

    Challenges

    Improve your report creation skills by participating in free challenges for report creators.

    Learn more
    Start trial
  • Services
    • Power BI Report Development
    • Custom Visual Development
  • Challenges
  • Pricing
Request a quote Start Free Book a Demo Sign in
Get it now
Go back

Contents

Go back

Share

Logo

Welcome to the Onyx Data December 2024 Challenge!

Nov 30 - Dec 19, 2024 | EST

Unwrap data insights this December with KYC and risk assessment reports for a dynamic banking institution. 🎀📈

Timeline

Registration Open

Registration Open

30 November | 19:00

-

Submissions Open

Submissions Open

30 November | 19:00

-

Workshop | Customer Analysis and Risk Assessment with Power BI

Workshop | Customer Analysis and Risk Assessment with Power BI

10 December | 06:00

-

1:1 Mentoring Sessions

1:1 Mentoring Sessions

10 December | 06:00

30 November - 16 December

Entry Submission Deadline

Entry Submission Deadline

16 December | 19:00

30 November - 16 December

Webinar | Review of Top 5 Reports from Bank Data Challenge

Webinar | Review of Top 5 Reports from Bank Data Challenge

20 December | 09:00

30 November - 16 December

Winner Announced

Winner Announced

20 December | 09:00

30 November - 16 December

Dataset

Get the dataset

See past Onyx Data challenges

See past challenges

Share the challenge

Submitted Reports
About challenge
How to participate
The Brief
Judging criteria (Updated!)
Timeline
Dataset
Past challenges

Winner of the challenge

Report Card

Aurora Bank Analysis

Author: Okeh Dono Efasa

32

View Report

All Submissions

Report Card

Bank analysis

Author: Sweety Antoni David

26

View Report
Report Card

Customer Analysis and Risk Assessment

Author: Agbata Dickson Ukolojo

1

View Report
Report Card

Aurora Bank - Customer Risk and Transaction Analysis

Author: Alejandra Barrios

13

View Report
Report Card

Aurora Bank Insights and Risk Analysis

Author: Ankan Bandyopadhyay

20

View Report
Report Card

Banking Report

Author: Raja Ayub

14

View Report
Report Card

Aurora Bank Data Analysis

Author: Fabian Vicencio Islas

5

View Report
Report Card

Aurora Bank Insights

Author: David Amri

0

View Report
Report Card

Aurora Bank Data Analysis

Author: Kanchan Kulkarni

0

View Report
Report Card

Aurora Bank Insights Dashboard

Author: Hugo Lopes

0

View Report
Report Card

Aurora Customer Analysis

Author: Rabibah Munir

0

View Report
Report Card

Aurora Bank Data Analysis

Author: Samson Obazee

1

View Report
Report Card

Aurora Bank Transactions Dashboard

Author: Jairus Jamero

1

View Report
Report Card

Aurora Bank

Author: Eszter Kovacs

3

View Report
Report Card

Report

Author: Raquel Pascual

1

View Report
Report Card

Aurora Bank Dataset

Author: Gamal Mahmoud

0

View Report
Report Card

Aurora Bank emna

Author: Emna Toumi

0

View Report
Report Card

Aurora Analysis Report

Author: Emmanuel Idowu

0

View Report
Report Card

Aurora Bank Data Challenge

Author: Shubham Shinde

0

View Report
Report Card

Banking Data Analysis

Author: Richard Mukechiwa

1

View Report
Report Card

Aurora Bank Data Analysis

Author: Lavanya Rai

0

View Report
Report Card

Aurora Bank Data Analysis

Author: Houssam Damerji

7

View Report
Report Card

Dashboard Aurora Bank

Author: Emanuel Rodríguez

0

View Report
Report Card

Aurora Bank Insights

Author: Lalit Mohan Pant

3

View Report
Report Card

Aurora_Dashboard_Onyx_Zoomcharts_Crystal

Author: Crystal Andrea Dsouza

0

View Report
Report Card

Aurora Bank Customer Credit Analysis

Author: Gori Omotola

0

View Report
Report Card

Aurora Bank Insight Report

Author: Lucky Nosakhare Odeh

5

View Report
Report Card

Aurora Bank Report

Author: Suleman Abdulmalik

0

View Report
Report Card

Customer Transaction Insights Analysis for DataDNA Challenge

Author: Donn Bryan Julian

3

View Report
Report Card

Auora Bank Segmentation and Risk Analysis

Author: Fabian Caballero

1

View Report

About ZoomCharts Mini Challenge

ZoomCharts Mini Challenge is part of the global DataDNA – Dataset Challenge by Onyx Data, which unites 11K+ data enthusiasts worldwide, ranging from beginners to seasoned professionals, including Microsoft MVPs. Read more about the DataDNA challenge on the Onyx Data website. Join the community on LinkedIn

The ZoomCharts Mini Challenge provides a platform for a growing community to learn how to build PRO reports, aiding business users to explore data quickly and intuitively.

  1. Free License: All participants receive a free ZoomCharts Developer License that gives access to the full Drill Down PRO visuals library. License will remain active for 1 year after the challenge.
  2. Learn from Experienced Professionals: As part of the challenge, we host live workshops on report building and visualizing the challenge’s dataset in Power BI. Challenge participants can also book an individual consultation with an experienced Power BI mentor to ask questions and get personalized tips.
  3. Tailored Feedback: Every challenge submission will receive personalized feedback, giving participants the chance to hone their skills and improve their reports.

Prizes

The best report’s creator will receive a $300 Amazon gift card from ZoomCharts. The Top 5 submissions and the winner will be announced on December 20th. 

Webinar recordings

Recording thumbnail

Customer Analysis and Risk Assessment with Power BI

Workshop for the December DataDNA challenge 

Watch the recording
Recording thumbnail

Review of Top 5 Reports from Bank Data Challenge

Best DataDNA ZoomCharts Mini Challenge submissions + the winner announcement

Watch the recording

How to participate? 

1. Register for the challenge: 

  • Download the DataDNA Challenge dataset either on this Challenge page or from Onyx Data website. 
  • Register for DataDNA ZoomCharts Mini Challenge.
  • Activate your free Drill Down Visuals Developer License for Power BI. Read license setup instructions.

2. Build your report in Power BI: 

  • Set up an account in Power BI using the assigned license details (if you have participated in ZoomCharts Challenges in the past, you can use the same account you set up before).
  • Use the account to access the full library of custom ZoomCharts Drill Down visuals. 
  • Use the dataset to build a Power BI report including at least 2 ZoomCharts Drill Down Visuals in one report page. 

3. Improve your report and learn new skills: 

  • To learn more about applying ZoomCharts visuals in your reports, participate in the challenge workshop. 
  • If you have any questions or need advice, you can book a free individual consultation. 
  • Check out the submissions from past challenges for inspiration. 

4. Submit your challenge entry: 

  • Submit your report in .pbix format for validation. 
  • If your submission doesn’t match the challenge criteria, you will be notified by email indicating the reason. Don't worry if this happens! You can fix the issue and resubmit your report. 
  • Together with validation confirmation you will receive a publish to web link that you can use to add the report to your portfolio or publicly share online. 
  • All validated entries will receive personalized feedback from the evaluation team. You can use this feedback to revise your report and resubmit it before the deadline. Feel free to resubmit your entry as many times as necessary before the deadline. 

5. Finalize your participation to compete for the prize: 

  • Post the final version of your submission as a single image on your LinkedIn profile, including the tags @ZoomCharts and @OnyxData, as well as the hashtags #dataDNA and #builtwithzoomcharts.
  • After posting the report on LinkedIn, please complete this form. 
  • Follow ZoomCharts on LinkedIn 
  • Follow Onyx Data on LinkedIn 
  • All participants of ZoomCharts Mini Challenge who have filled in the form are also valid to compete in the main Onyx Data DataDNA challenge for a chance to win additional prizes. Read more here. 

6. Attend challenge closing webinar to hear the results: 

  • The submissions are evaluated by ZoomCharts team (see "Judging criteria" for more info). The submissions of Top 5 ZoomCharts Mini Challenge finalists are analyzed live during the challenge closing webinar to share the best practices and learning opportunities with the community.
  • The author of the best report is rewarded with a $300 Amazon gift card from ZoomCharts. 

Challenge Description:

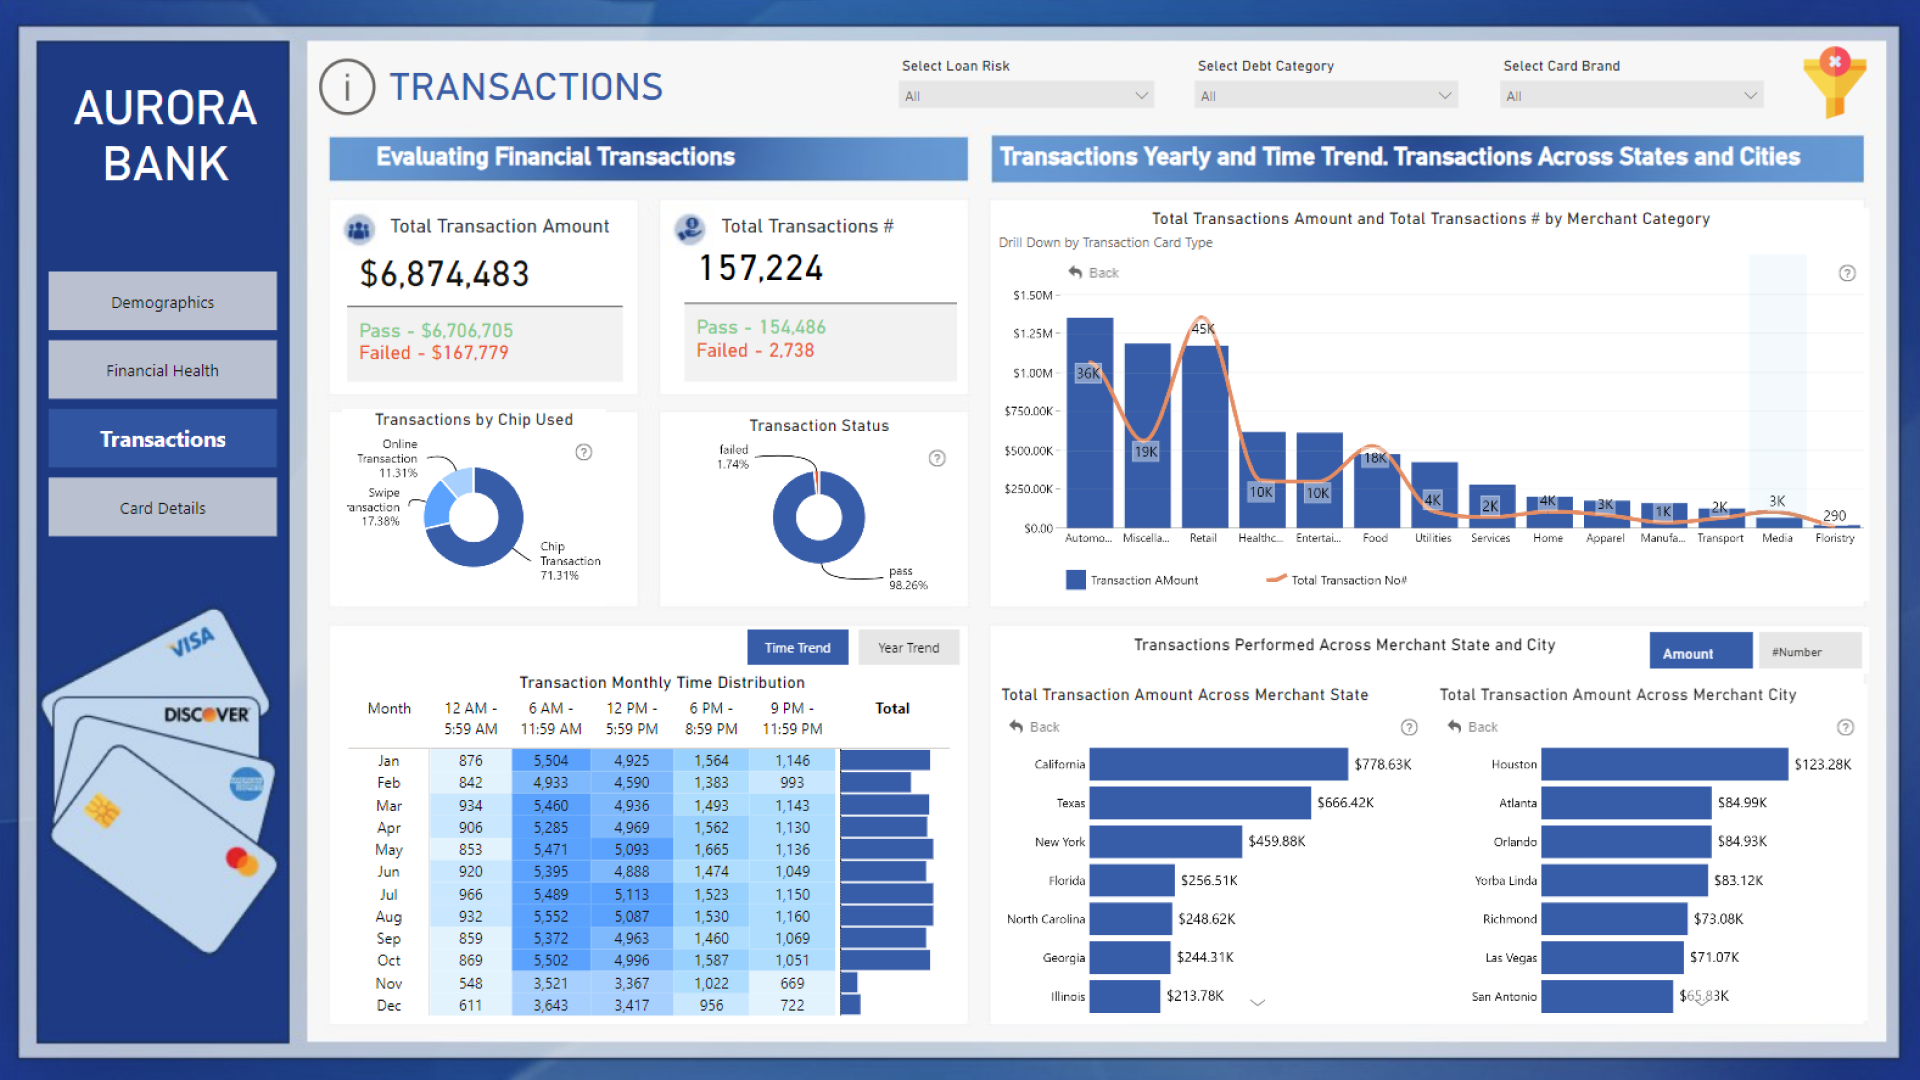
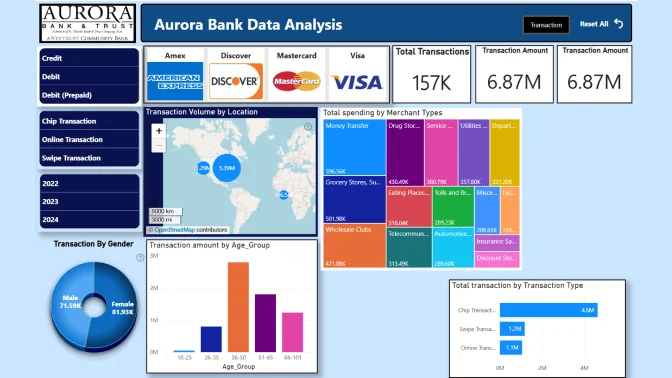
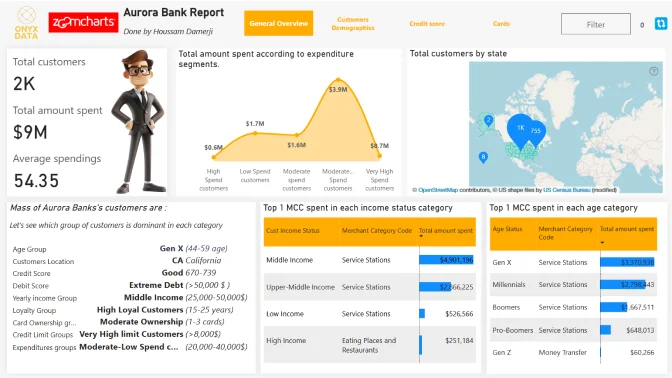
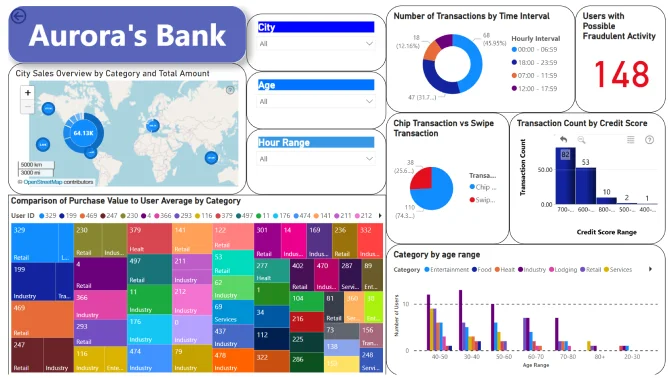
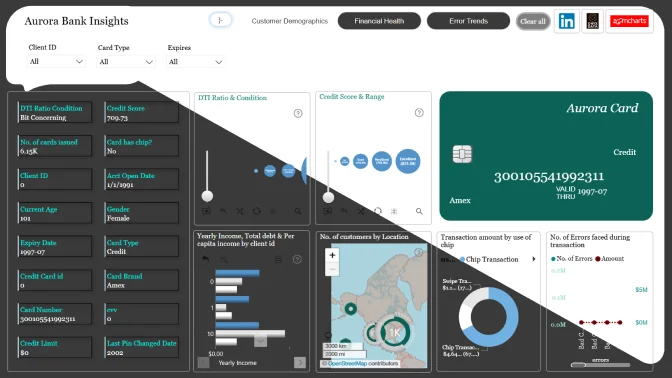
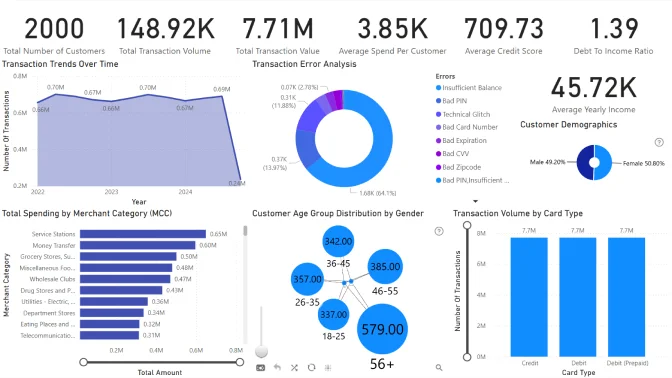
Welcome to the Aurora Bank Data Challenge! As a data analyst at one of the most dynamic financial institutions, you're tasked with uncovering critical insights from data on customers, transactions, cards, and merchant categories. Aurora Bank is counting on you to solve pressing challenges and deliver actionable insights.

Your Mission:

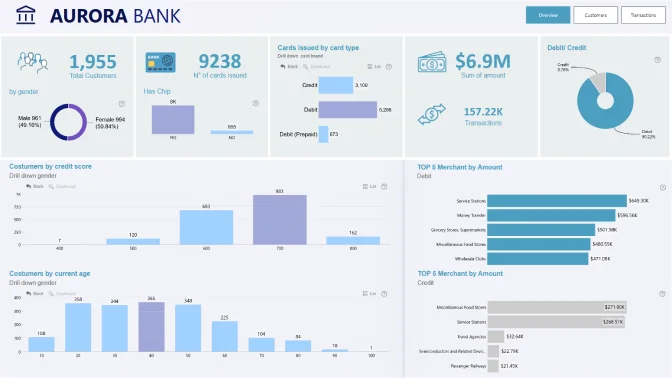
  • Understand Customer Profiles: Explore customer demographics, financial health, and behaviors to unlock new opportunities for engagement.
  • Analyze Spending Trends: Uncover patterns and growth opportunities in transaction data.
  • Identify Risks: Spot potential red flags in rising debt, transaction errors, and fraudulent activity.
  • Create Impactful Dashboards: Use Power BI to present your insights visually, telling Aurora Bank’s data story.


Choose your own analytical approach, or focus on one of the below options:

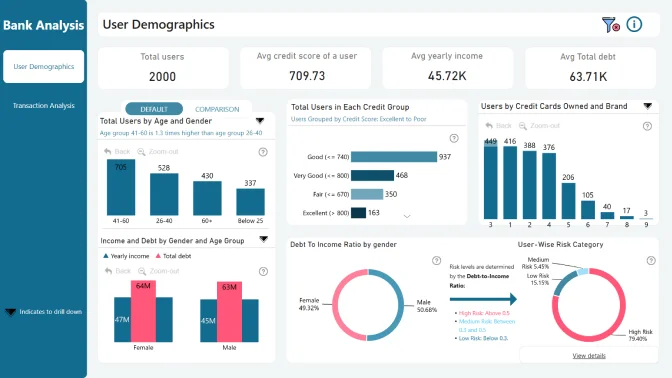
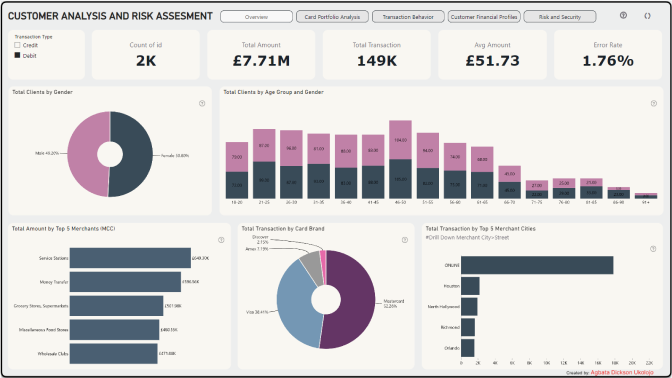
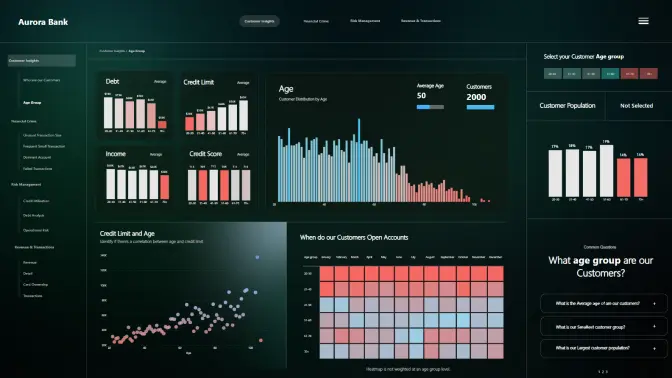
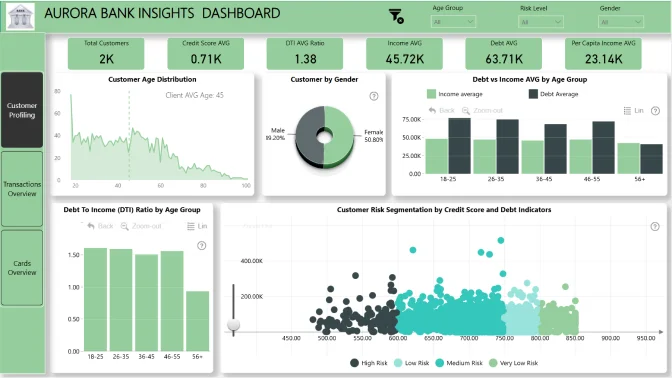
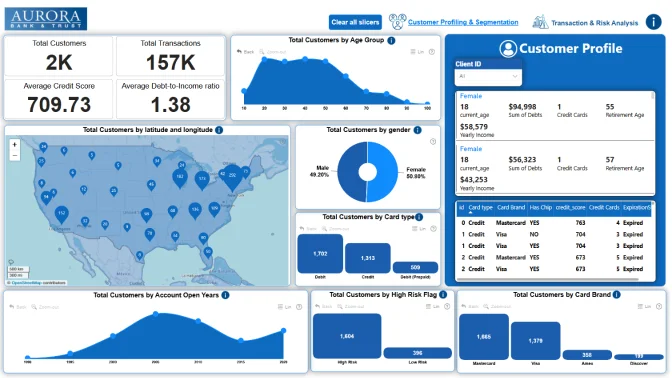
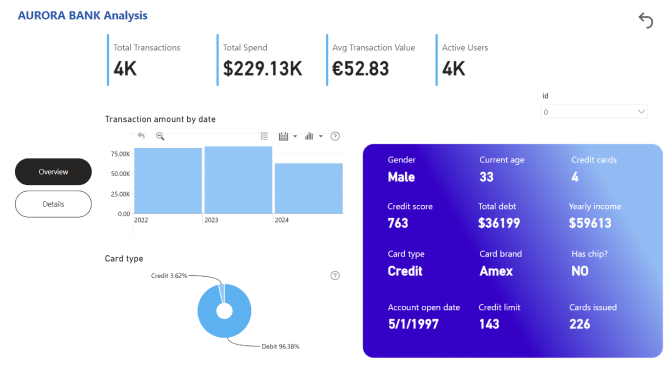
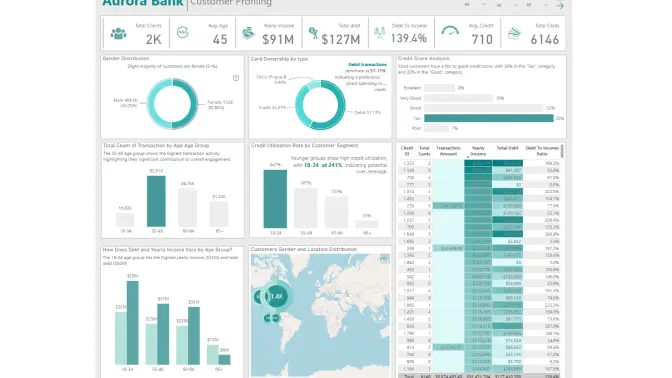
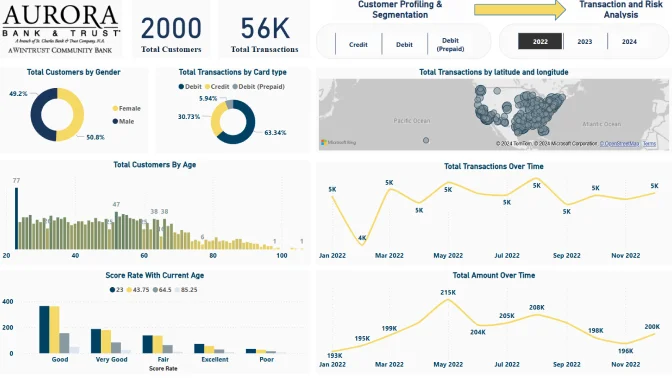
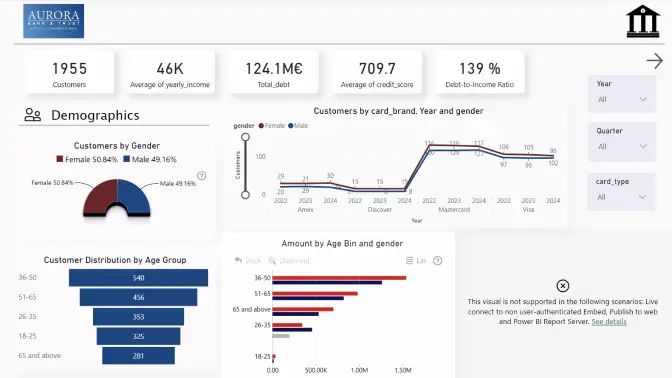
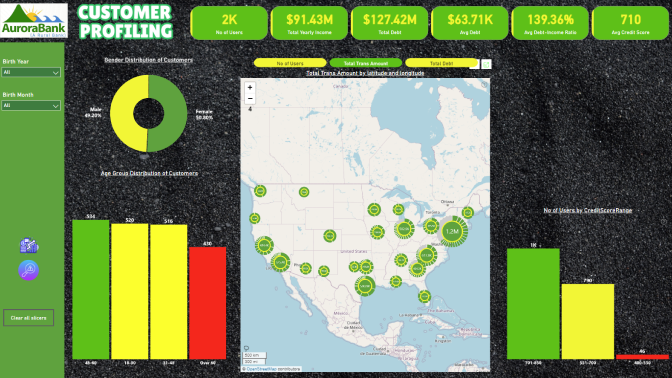
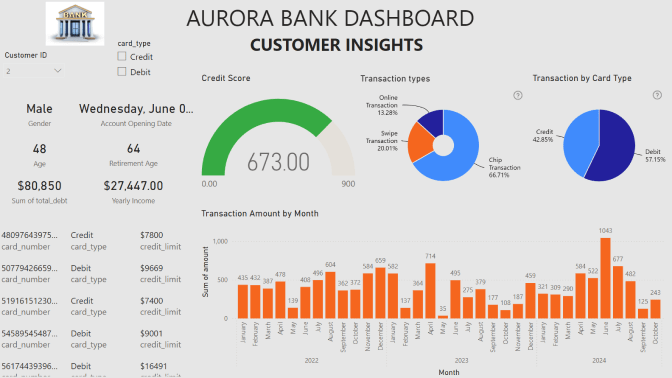
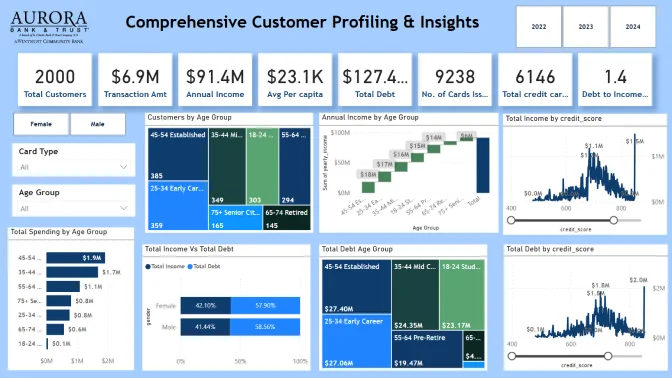
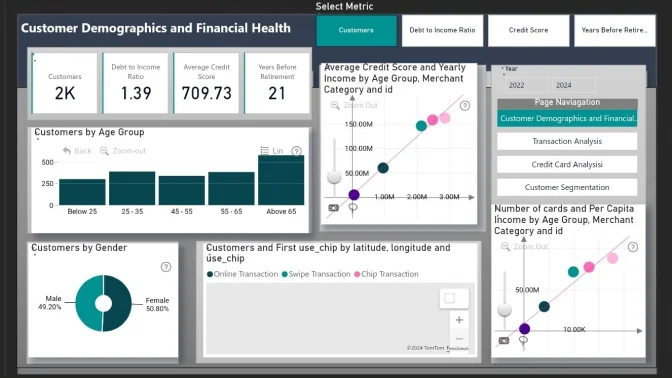
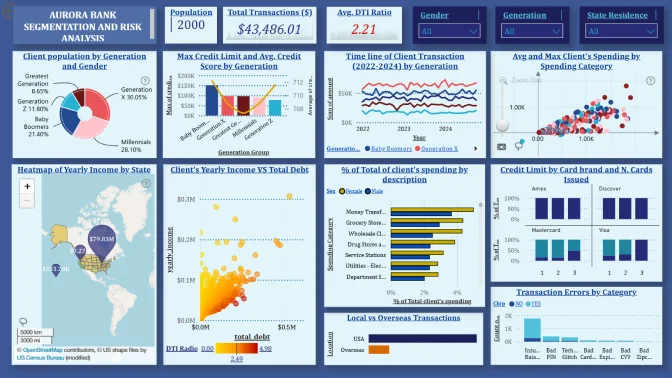
1. Customer Profiling & Segmentation

Gain a deep understanding of customer demographics, financial health, and behaviors to enable personalized marketing strategies and assess customer risk levels.

Focus Areas:

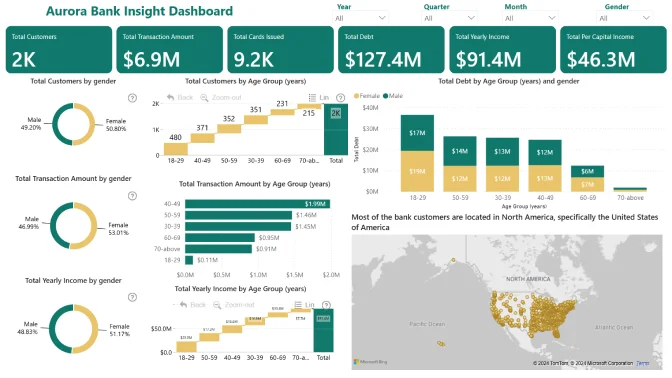
  • Customer Demographics: Analyze the age, gender, and geographical distribution of customers.
  • Credit Score Analysis: Explore the distribution of credit scores and the factors influencing them (e.g., income, debt, age).
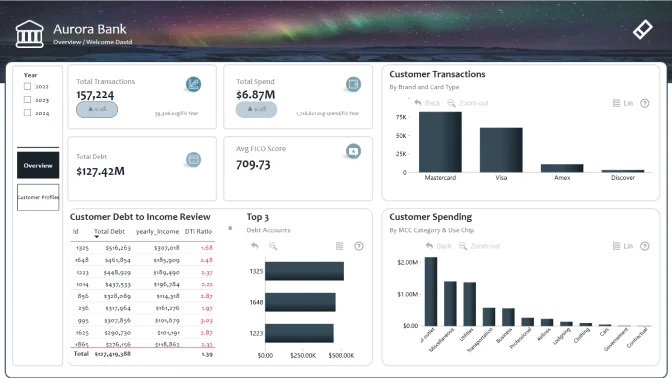
  • Financial Health: Calculate debt-to-income ratios and identify high-risk customers.
  • Card Ownership: Assess the number of credit/debit cards per customer and usage trends by demographic.


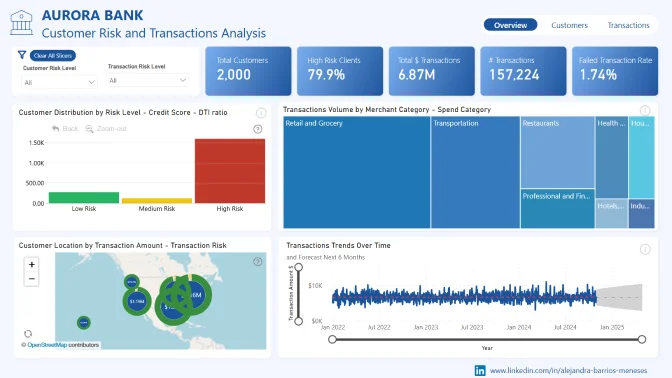
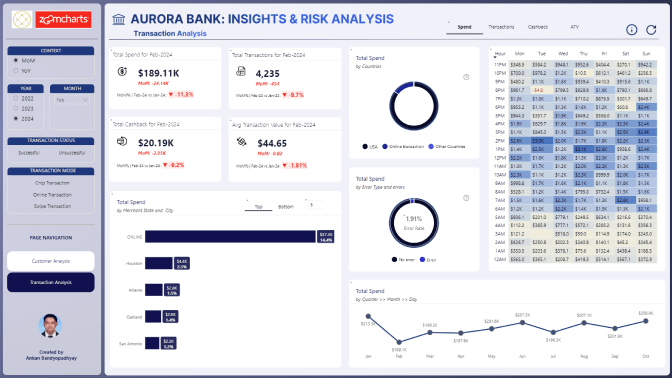
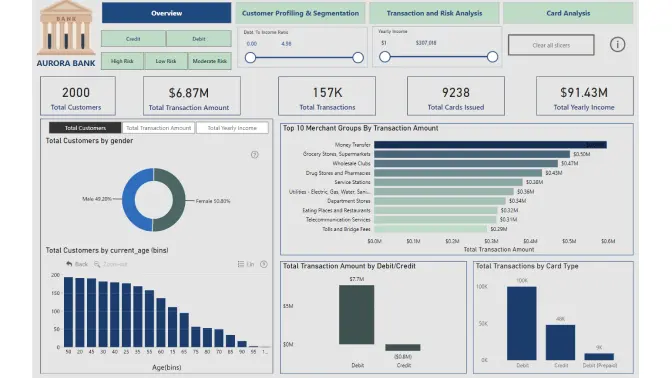
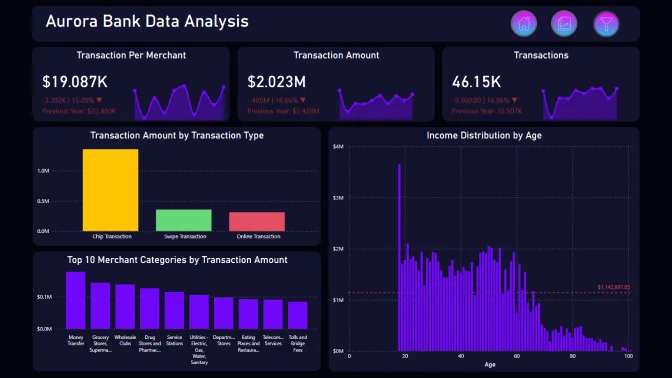
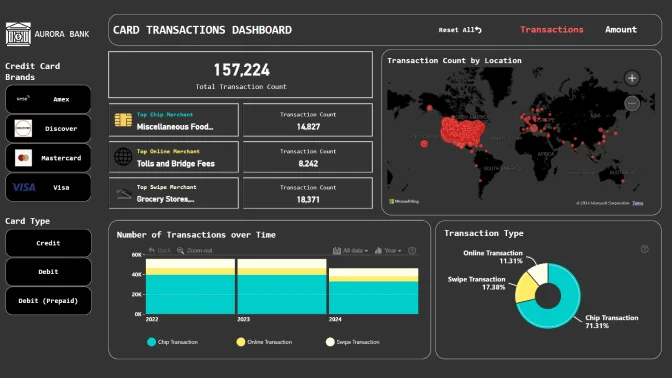
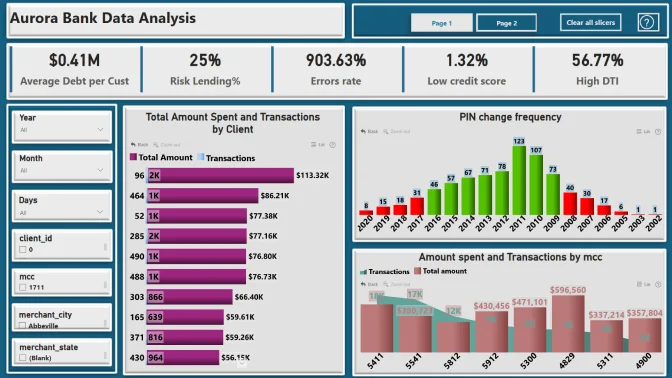
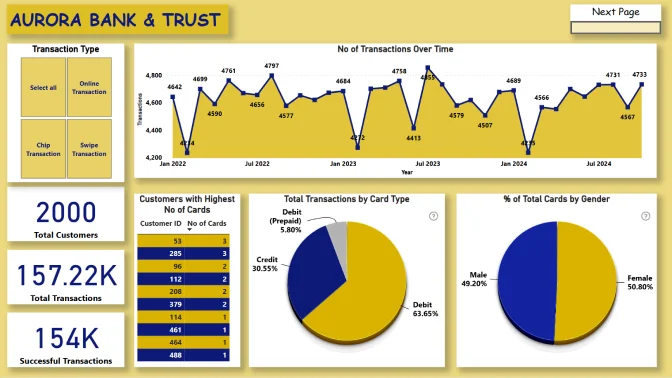
2. Transaction and Risk Analysis

Understand customer spending behaviors while enhancing fraud detection and ensuring compliance with regulations to minimize risks.

Focus Areas:

  • Spending Patterns: Evaluate transaction volumes by merchant categories (MCC) or locations.
  • Geographical Trends: Identify high-spending regions or locations prone to failed transactions.
  • Error Trends: Monitor transaction errors (e.g., bad PIN entries) to enhance user experience.
  • High-Value Transactions: Flag unusually high-value transactions for potential fraud detection.
  • Credit Risk: Identify customers at risk of default based on debt-to-income ratios and credit score trends.
  • Debt Levels: Analyze the distribution of total debt across customers for portfolio risk management.


Technical requirements

  • Build your report using only Power BI
  • The number of pages in the report is not limited
  • At least one report page has to contain a minimum of 2 ZoomCharts Drill Down Visuals. See a practical guide on Drill Down Visuals here

Judging criteria

Each report is evaluated based on three main criteria: intuitiveness, insightfulness, and interactivity. These factors ensure that the reports are not only accurate and functional, but also meet the target audience's needs and are ready to be presented to the end-users. 

  1. Intuitive: How clear and easy it is to understand the report at a glance? (max 15 points)
    • Is the report visually appealing?
    • Choice of charts and visual elements
    • Does the report tell a story?
    • Is it not overwhelming to the user?
    • Choice of tooltips, titles, and legends

  2. Interactive: How engaging and seamless is the report exploration and interaction with data? (max 15 points)
    • Clear navigation that allows user to explore the report
    • Use of slicers and other interactive elements
    • Smooth cross-chart integration
    • Is report optimized for touch devices?
    • Are tutorials and guiding elements helpful to the user?

  3. Insightful: How accurate, complete, and meaningful is the data in driving decisions? (max 15 points)
    • Depth of analysis
    • Data cleaning and preparation
    • Does data show up accurately in the report?
    • Is report optimized for quicker loading time?
    • Does the report provide deeper exploration of data (drill-down)?


Timeline

Registration Open

Registration Open

30 November | 19:00

-

Submissions Open

Submissions Open

30 November | 19:00

-

Workshop | Customer Analysis and Risk Assessment with Power BI

Workshop | Customer Analysis and Risk Assessment with Power BI

10 December | 06:00

-

1:1 Mentoring Sessions

1:1 Mentoring Sessions

10 December | 06:00

30 November - 16 December

Entry Submission Deadline

Entry Submission Deadline

16 December | 19:00

30 November - 16 December

Webinar | Review of Top 5 Reports from Bank Data Challenge

Webinar | Review of Top 5 Reports from Bank Data Challenge

20 December | 09:00

30 November - 16 December

Winner Announced

Winner Announced

20 December | 09:00

30 November - 16 December

Dataset

Get the dataset

See past Onyx Data December 2024 challenges

See past challenges

Your Drill Down Visuals Developers License

Use the email and password provided below to log in Power BI Desktop and access an account with a license to use all ZoomCharts Drill Down Visuals.

Upon logging in, you will need to change your password and enable two-factor authentication. If you encounter any problems, feel free to reach out to us via chat.

*This Developer License can be used to create a report for this ZoomCharts Mini Challenge or for your personal training purposes. Commercial use of this license is prohibited.

Upload failed
Attach file
File requirements: 16MB

Any questions? Feel free to use chat!

Are you sure you want to delete the report?

Activate your Drill Down visuals Developer License!

You can use these credential to access ZoomCharts visuals and create your report for this ZoomCharts Mini Challenge, or for your personal training purposes.


logo
[email protected]
+44 204 577 3993
logo

Products

Drill Down Network PRO Drill Down Waterfall PRO Drill Down Graph PRO Drill Down Combo PRO Drill Down Combo Bar PRO Drill Down Donut PRO Drill Down Pie PRO Drill Down TimeSeries PRO Drill Down Timeline PRO Drill Down Map PRO Drill Down Scatter PRO All Visuals

Resources

Report Examples Webinars Blog ZoomCharts Academy Visuals Gallery Documentation Custom Visual Development Subscribe to News

Solutions

Custom Visual Development

Company

Pricing About Us Partners Leave feedback Join PowerGroup EU Funding

Help

ZoomCharts Assistance Contact Sales Contact Support FAQ

Drill Down Network PRO Drill Down Waterfall PRO Drill Down Graph PRO Drill Down Combo PRO Drill Down Combo Bar PRO Drill Down Donut PRO Drill Down Pie PRO Drill Down TimeSeries PRO Drill Down Timeline PRO Drill Down Map PRO Drill Down Scatter PRO All Visuals

Report Examples Webinars Blog ZoomCharts Academy Visuals Gallery Documentation Custom Visual Development Subscribe to News

Custom Visual Development

Pricing About Us Partners Leave feedback Join PowerGroup EU Funding

ZoomCharts Assistance Contact Sales Contact Support FAQ
+44 204 577 3993
[email protected]

Ready to get in touch?

Contact our experts with any question about Power BI and ZoomCharts for Free!

Contact us

© 2025, Data Visualization Software Lab

U.S. Patents No. 11,645,343; 11,921,804

Cookies Policy
Manage cookies
Privacy Policy
Global
EULA
Patent
warning

Error message

success

Success info: Done!

ZoomCharts AI Assistant

We noticed you're using an old OS version.

For the best experience, we recommend upgrading to ensure that all website features display correctly.

Cookie settings

We use necessary cookies for site functionality, as well as statistic, marketing, and preference cookies to enhance your experience. For more information and to manage your preferences, please visit our Cookie policy