814
Aurora Bank Data Analysis 4
Aurora Bank Data Analysis 4
Report Author: Lavanya Rai
814
Share template with others
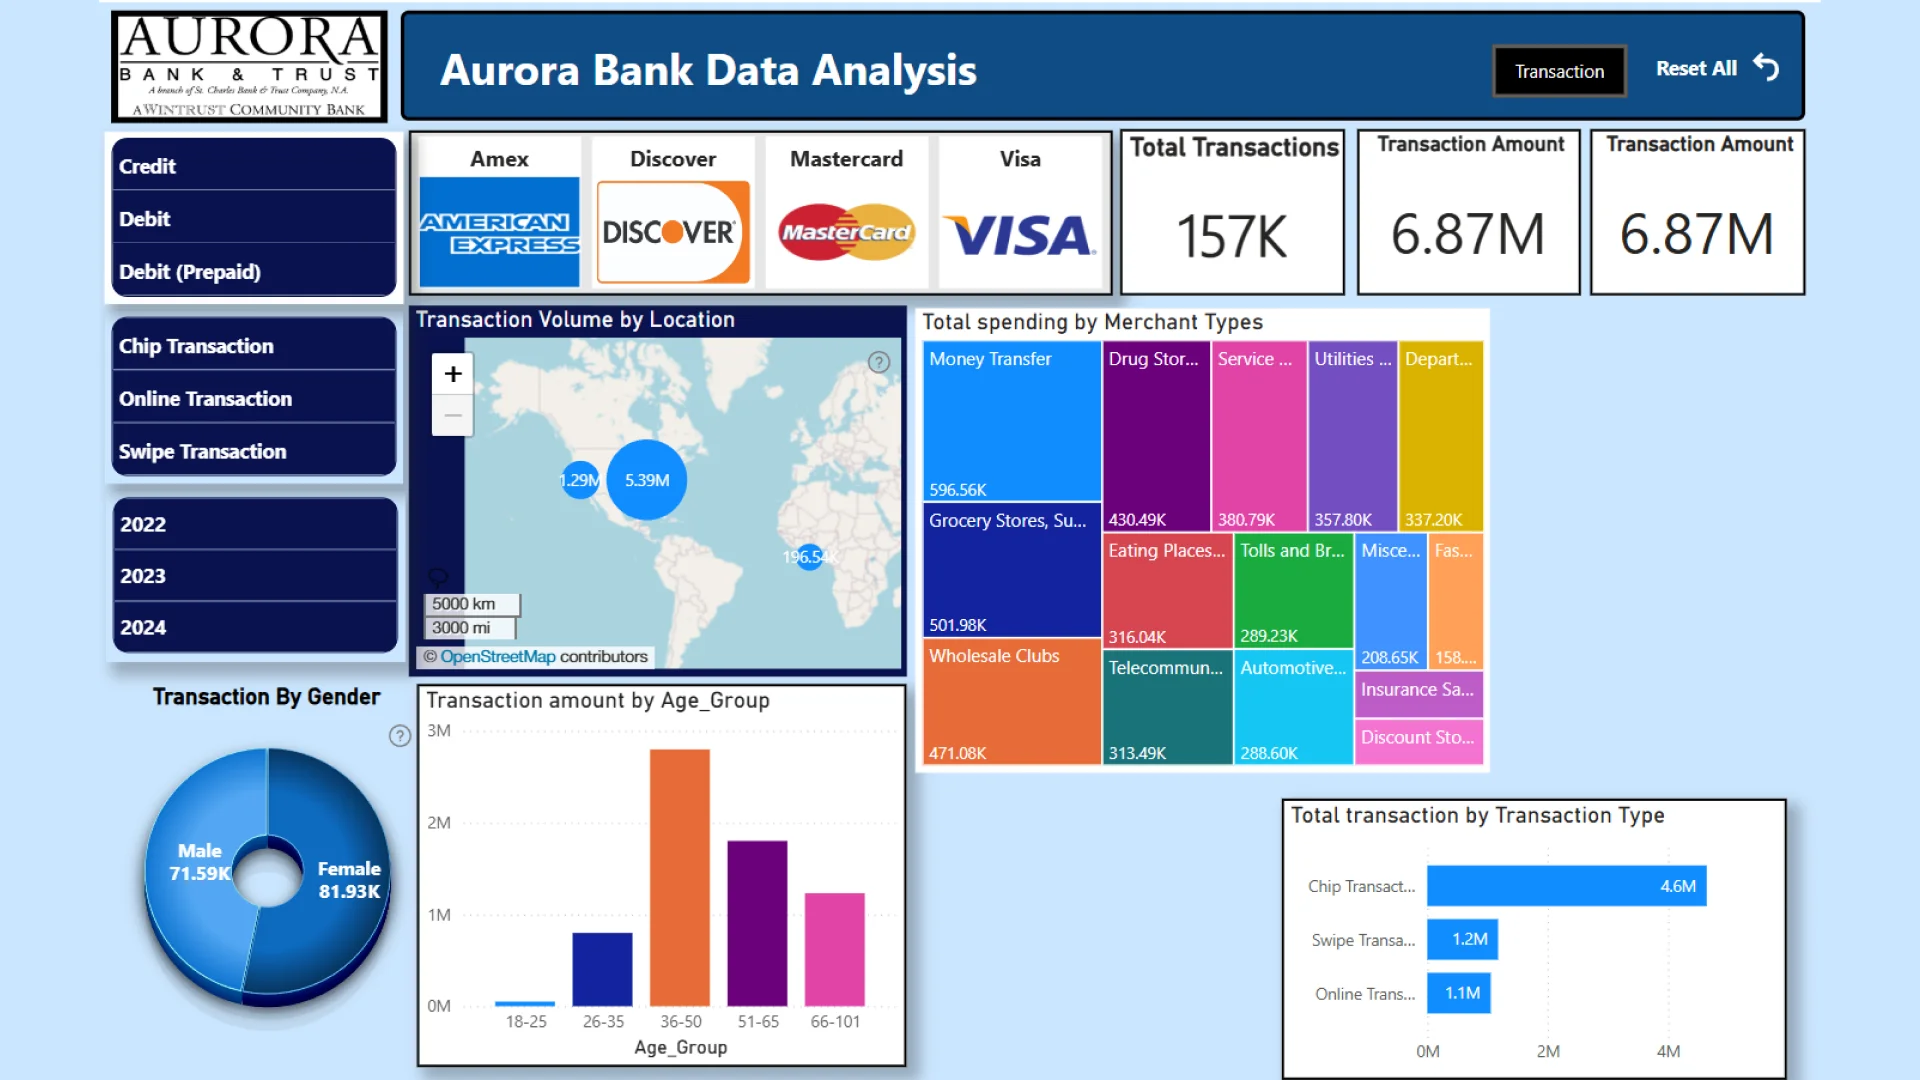
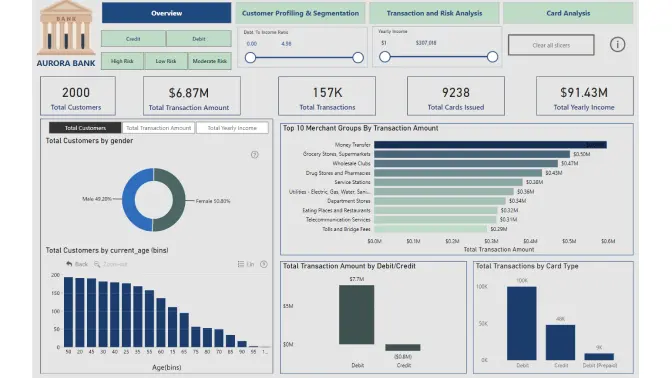
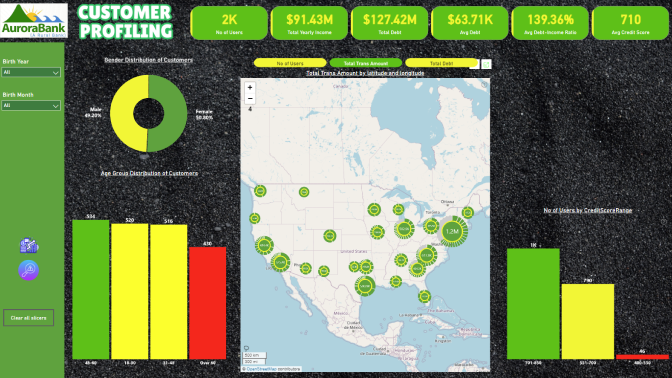
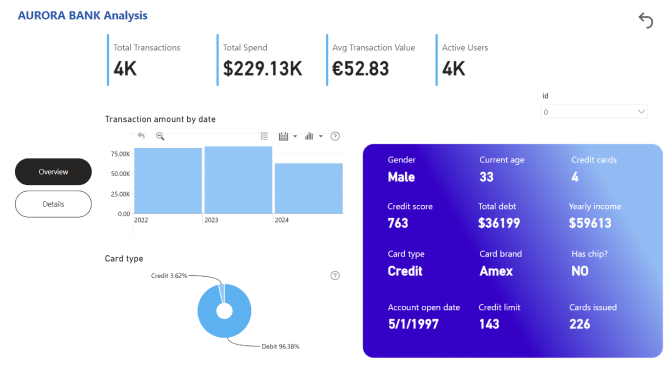
Report submitted for Onyx Data DataDNA ZoomCharts Mini Challenge, December 2024. The report is based on the Aurora Bank dataset and includes ZoomCharts custom Drill Down PRO visuals for Power BI.
Author's description:
My Aurora Bank Data Challenge report leverages Power BI to deliver actionable insights on customer profiling and transaction analysis. It includes an in-depth exploration of customer demographics, credit scores, and financial health, alongside a segmentation of spending patterns across merchant categories. Key risks, such as high debt-to-income ratios and unusual transactions, are highlighted for improved risk management. Interactive visuals enable a seamless analysis of trends, errors, and geographical spending patterns.
4U Report Challenges
Participate in data challenges, build and submit reports to get free template downloads.
Join CommunityMobile view allows you to interact with the report. To Download the template please switch to desktop view.
Was this helpful? Thank you for your feedback!
Sorry about that.
How can we improve it?