logo
For Power BI
  • Products
    • Drill Down Donut Pro Drill Down Donut PRO
    • Drill Down Pie Pro Drill Down Pie PRO
    • Drill TimeSeries Pro Drill Down TimeSeries PRO
    • Drill Combo Pro Drill Down Combo PRO
    • Drill Map Pro Drill Down Map PRO
    • Drill Scatter Pro Drill Down Scatter PRO
    • Drill Down Network Pro Drill Down Network PRO
    • Drill Down Waterfall Pro Drill Down Waterfall PRO
    • Drill Down Graph Pro Drill Down Graph PRO
    • Drill Down Timeline Pro Drill Down Timeline PRO
    • Drill Down Combo Bar PRO Drill Down Combo Bar PRO

    Video tutorials

    Watch Now

    More than 90 videos on how to enhance Power BI with ZoomCharts

    Learn more
    All visuals
  • Resources

      Resources

    • Documentation
    • Report Examples
    • Blog
    • Webinars
    • Video Tutorials
    • Visuals Gallery

    Support

    • ZoomCharts Assistance
    • Contact Sales
    • Contact Support
    • FAQ

    Challenges

    Challenges

    Improve your report creation skills by participating in free challenges for report creators.

    Learn more
    Start trial
  • Services
    • Power BI Report Development
    • Custom Visual Development
  • Challenges
  • Pricing
Request a quote Start Free Book a Demo Sign in
Get it now
Go back

Contents

Go back

Share

Logo

Welcome to the FP20 Analytics May 2024 Challenge!

May 13 - Jun 19, 2024 | EDT

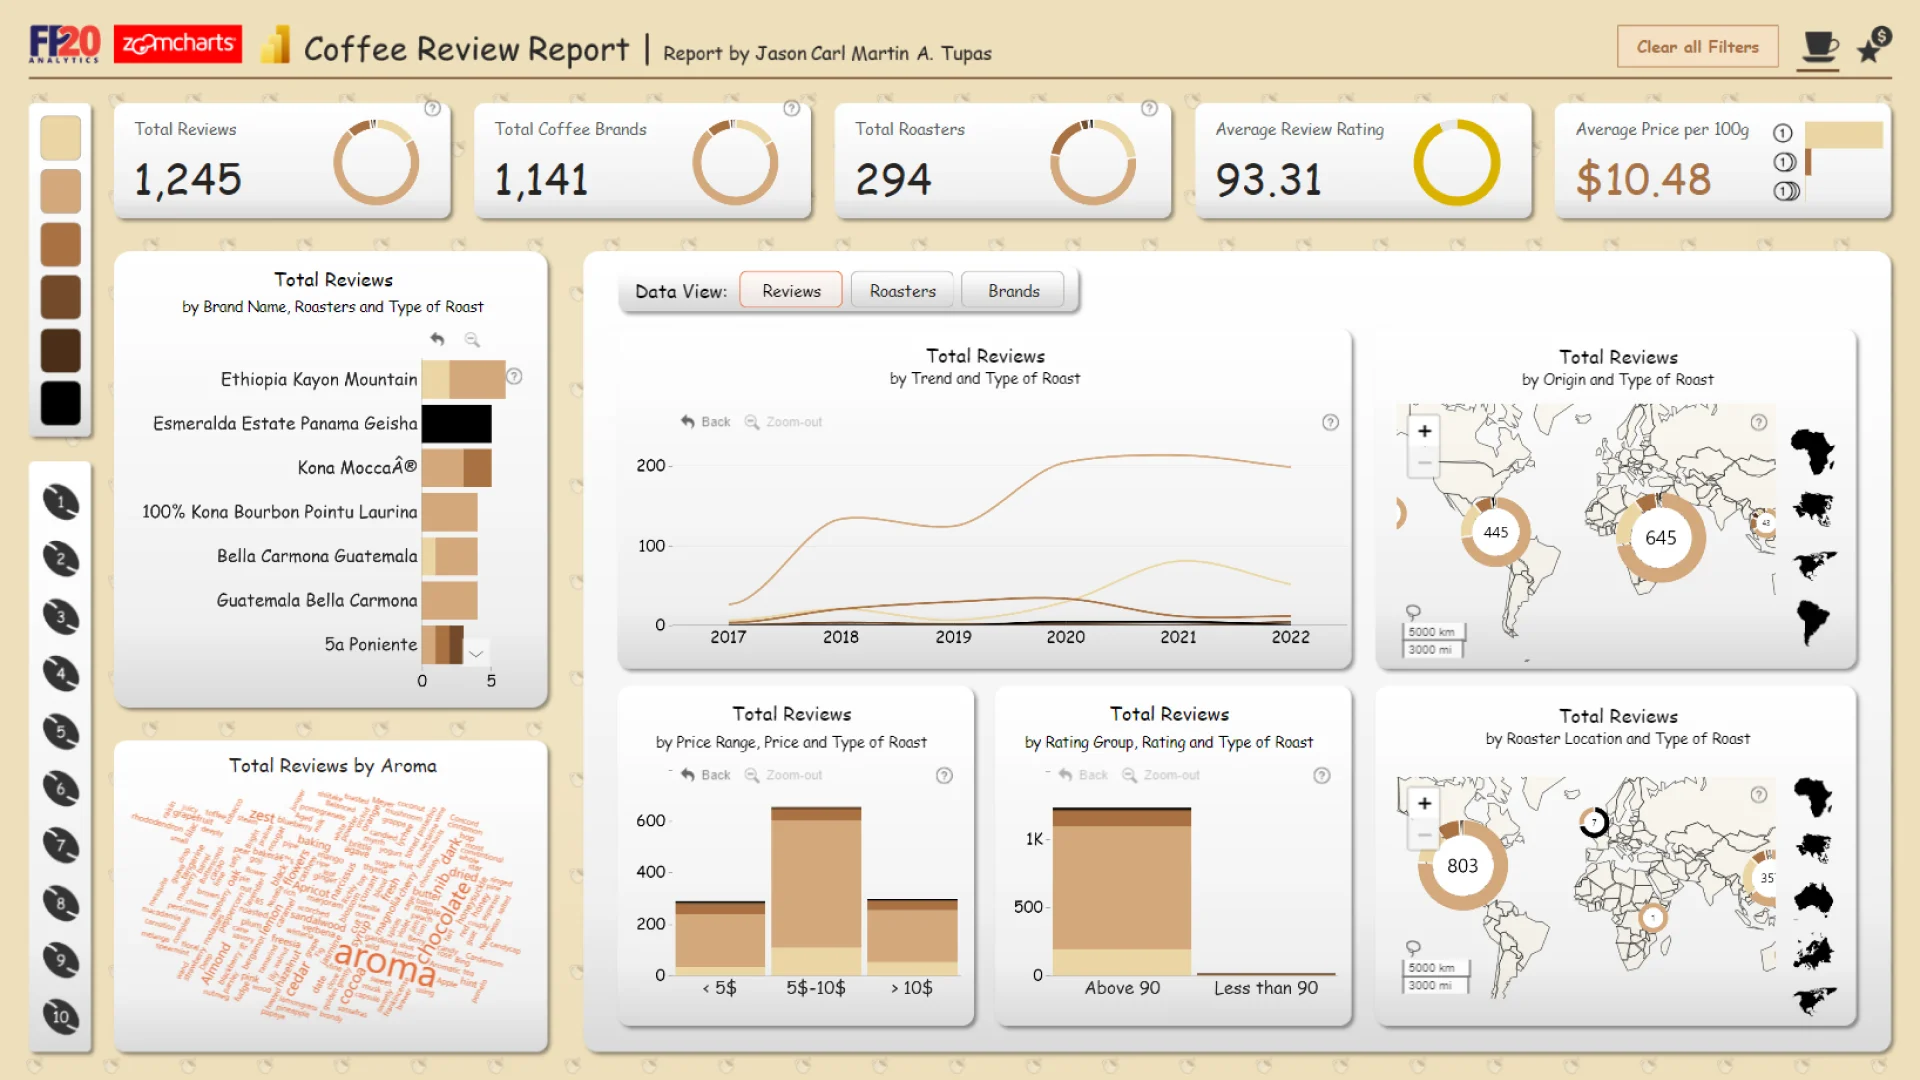
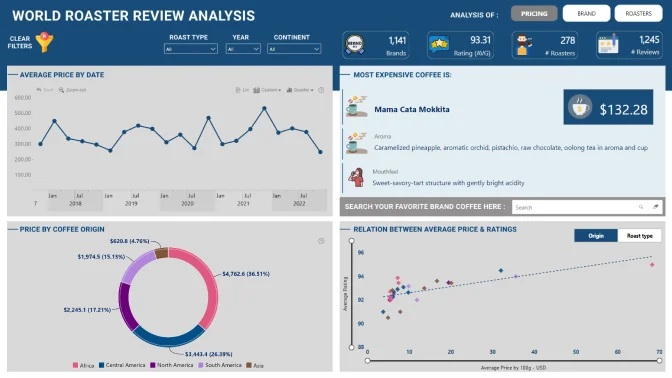
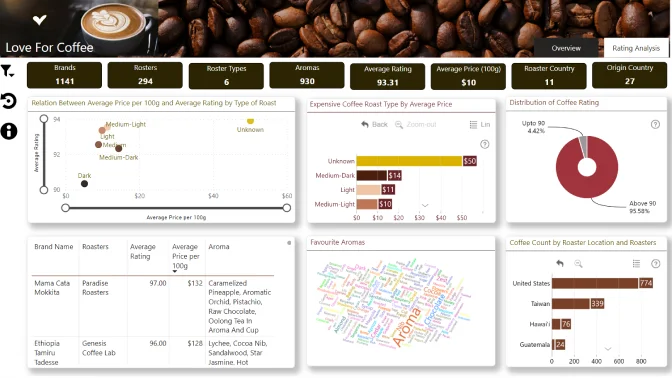
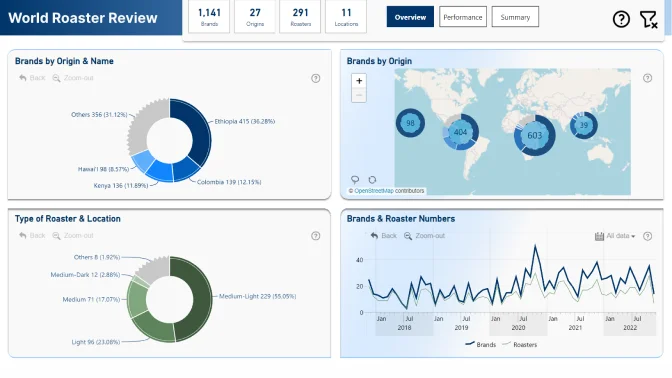
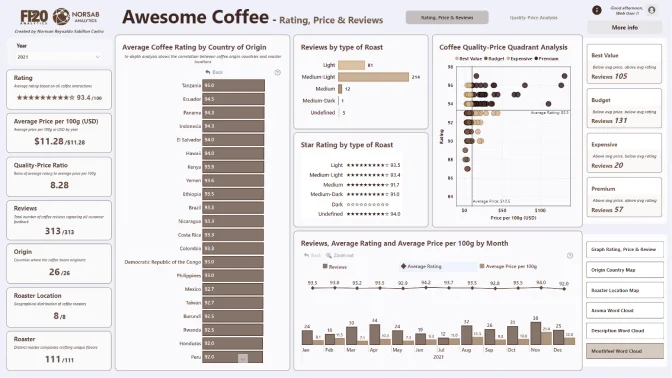
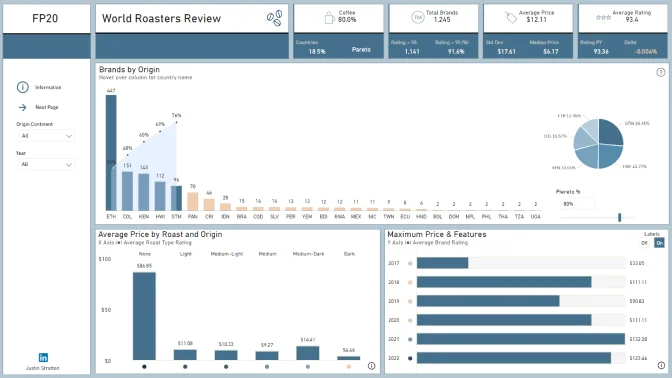
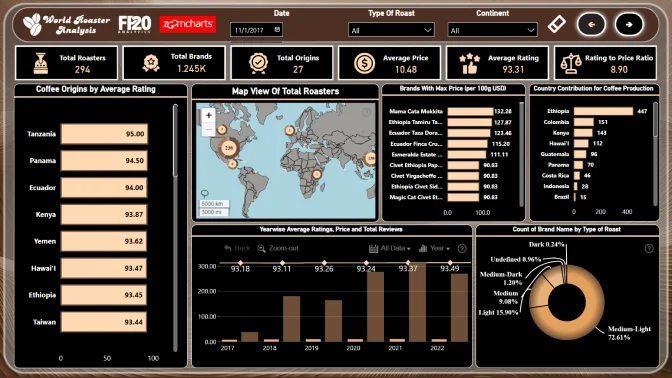
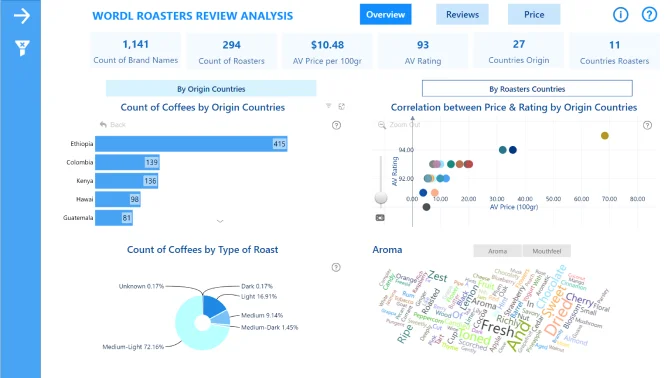
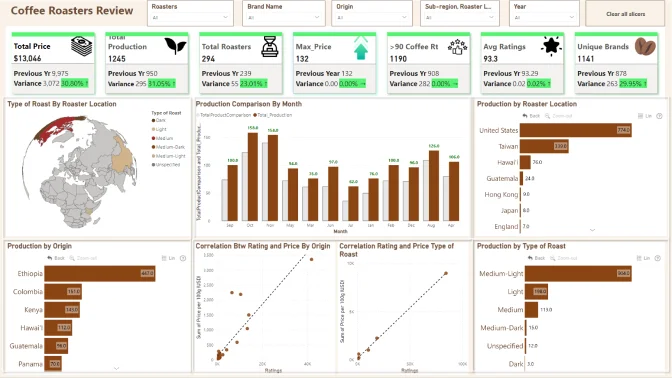
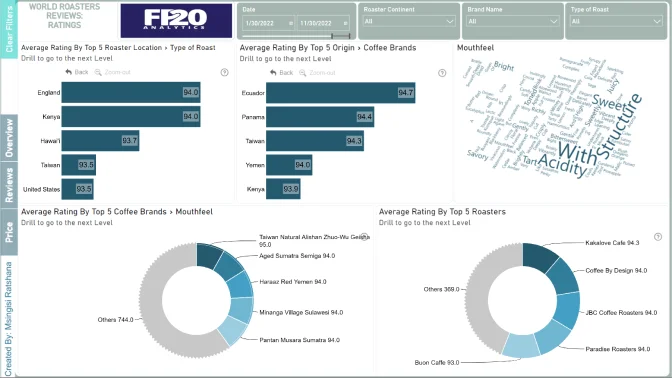
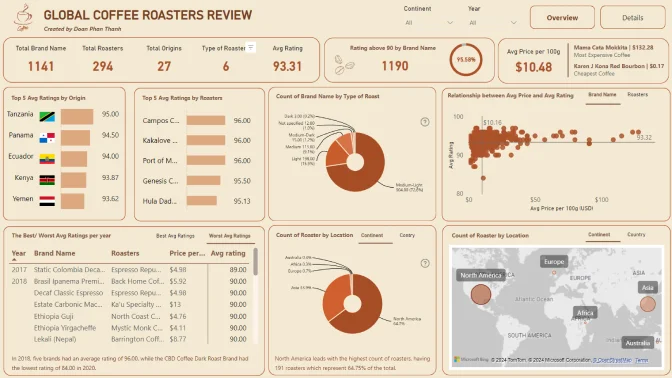
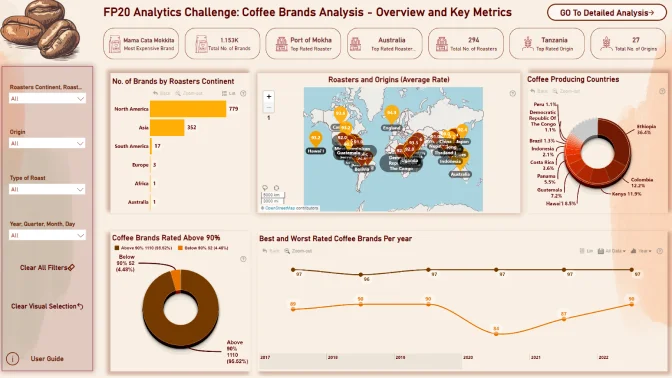
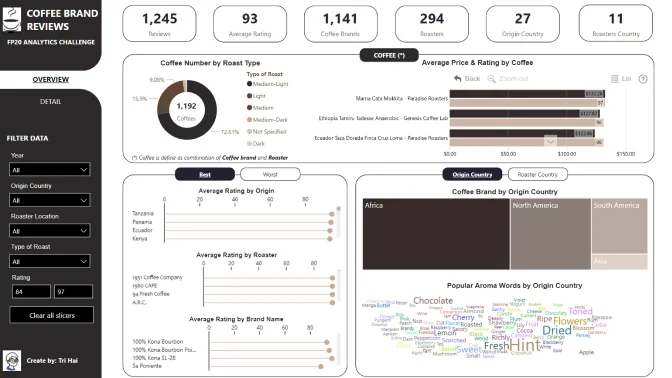
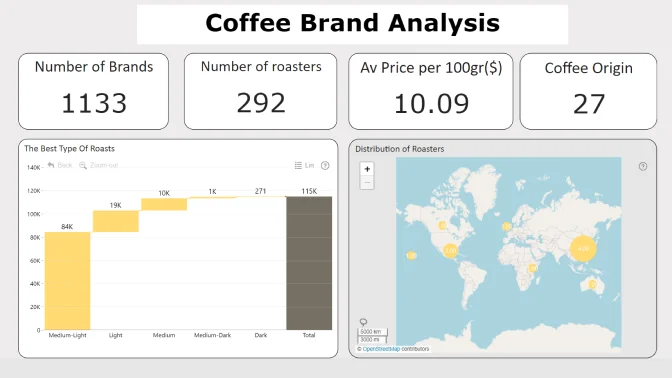
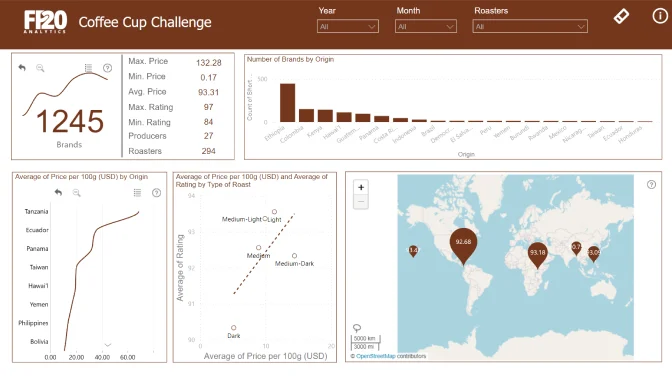
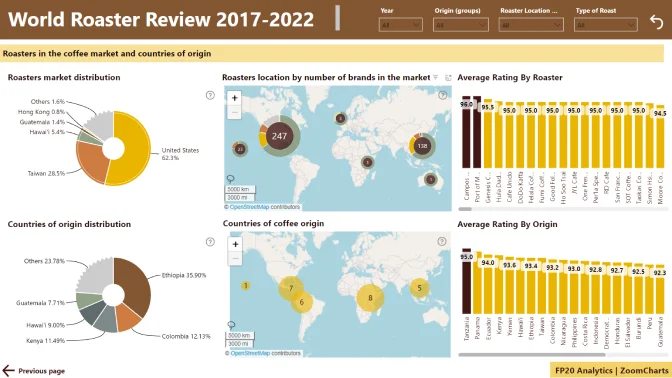
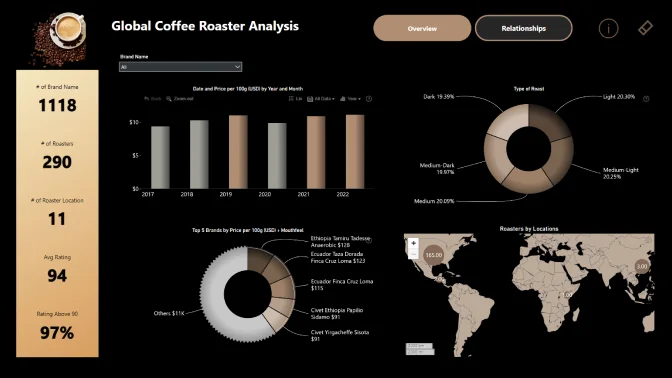
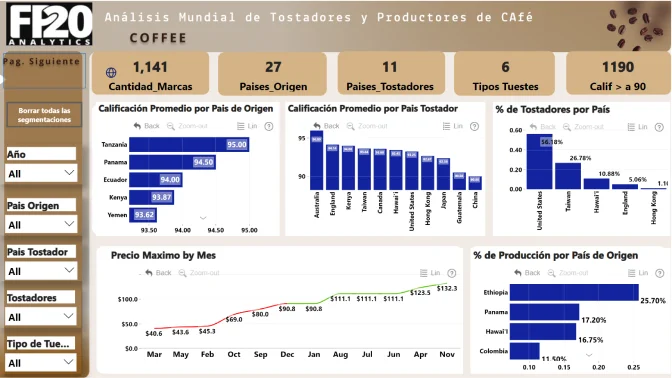
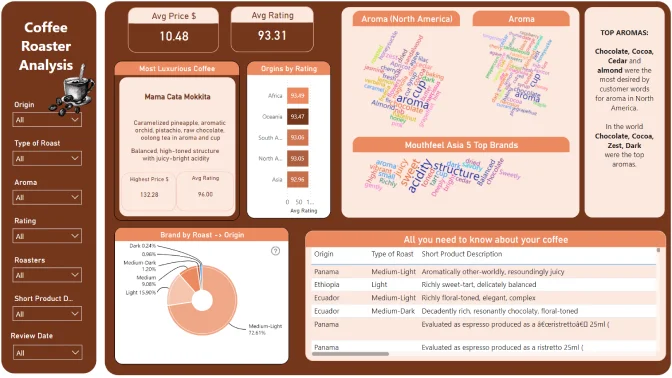
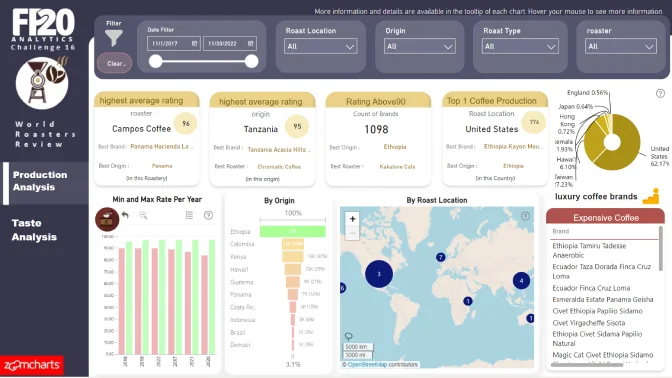
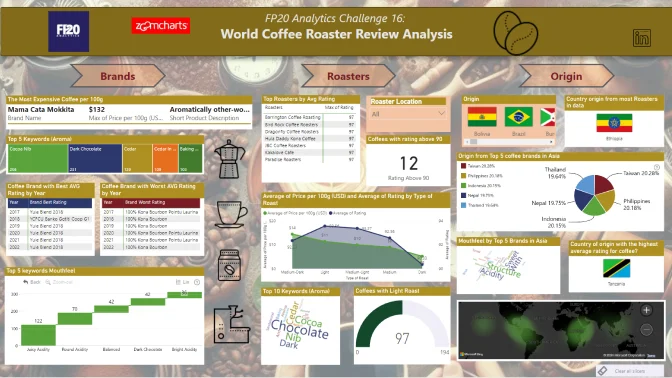
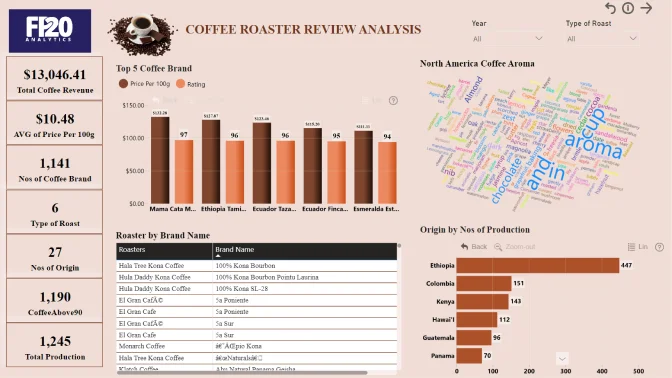
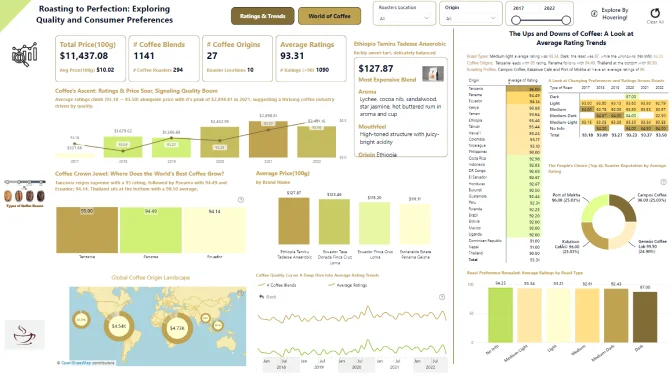
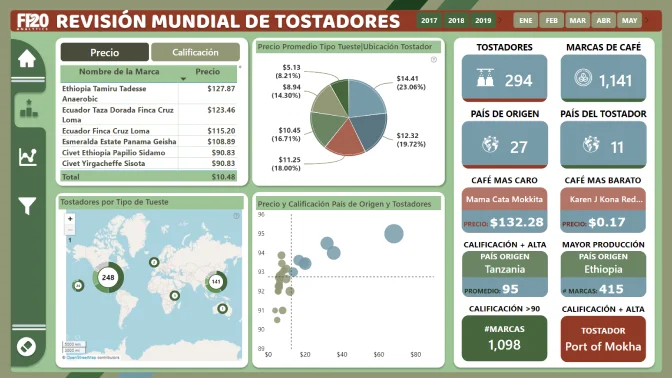
Have you ever wondered where your morning cup of coffee came from? Prepare to explore a rich dataset about coffee origins, roasts, prices, ratings, and more.

Timeline

Registration Open

Registration Open

13 May | 21:00

-

Submissions Open

Submissions Open

13 May | 21:00

-

Workshop | Prepare Your Best Coffee Roaster Data Analysis with ZoomCharts

Workshop | Prepare Your Best Coffee Roaster Data Analysis with ZoomCharts

23 May | 11:30

-

1:1 Mentoring Sessions

1:1 Mentoring Sessions

23 May | 11:30

13 May - 12 June

Entry Submission Deadline

Entry Submission Deadline

12 June | 21:00

13 May - 12 June

Webinar | Reviewing ZoomCharts TOP 5: Challenge 16 Finalists

Webinar | Reviewing ZoomCharts TOP 5: Challenge 16 Finalists

19 June | 11:00

13 May - 12 June

Winner Announced

Winner Announced

19 June | 11:00

13 May - 12 June

Dataset

Get the dataset

See past FP20 Analytics challenges

See past challenges

Share the challenge

Submitted Reports
About challenge
How to participate
The Brief
Judging criteria
Timeline
Dataset
Past challenges

Winner of the challenge

Report Card

Coffee Reviews Report

Author: Jason Carl Martin Tupas

21

View Report

All Submissions

Report Card

World Roaster Review Analysis

Author: Giancarlo Ramos de Rosas

7

View Report
Report Card

Coffee Brand Data Analysis

Author: Rashmi Gandhe

14

View Report
Report Card

World Roaster Review

Author: Rigoberto Garcia

8

View Report
Report Card

Coffee Brand Review

Author: My Nguyen

3

View Report
Report Card

Roaster Review Analysis

Author: Mayur Pawar

6

View Report
Report Card

World Coffee Roasters Review Analysis

Author: Hajnalka Siflis

3

View Report
Report Card

World Roasters Review

Author: Sirin Gurkan Aral

7

View Report
Report Card

Coffee Roaster Analysis

Author: Norman Reynaldo Sabillon Castro

9

View Report
Report Card

World Roasters Review

Author: Justin Stratton

5

View Report
Report Card

World Coffee Roaster Data

Author: Ashish Ransing

12

View Report
Report Card

World Roasters Review

Author: Iris Mejuto Crego

4

View Report
Report Card

Coffee Roasters Review

Author: Eniola Adekoya

5

View Report
Report Card

Roasters Reviews

Author: Msingisi Ratshana

3

View Report
Report Card

Global Coffee Roasters Review

Author: Phan Thanh Doan

8

View Report
Report Card

Coffee Brands Analysis

Author: Amro Elhalwagy

1

View Report
Report Card

Coffee Brand Review Analysis

Author: Phùng Trí Hải

2

View Report
Report Card

Coffee Analysis Report

Author: Abdulmalik ADEDOKUN

5

View Report
Report Card

Coffee Roaster Challenge

Author: Agbata Dickson Ukolojo

1

View Report
Report Card

COFFEE BRANDS REVIEW

Author: Alamutu Kehinde

2

View Report
Report Card

Coffee Brands Analysis

Author: Dan Nguyen

4

View Report
Report Card

Coffee Roaster Dataset Analysis

Author: Dereck Marin

0

View Report
Report Card

Coffee Roaster Review Analysis

Author: Ekaterina Vorobets

0

View Report
Report Card

Global Coffee Roaster Analysis

Author: Eszter Kovacs

5

View Report
Report Card

Coffee Review Analysis

Author: Hai Yen Do

9

View Report
Report Card

Coffee Roaster Metrics Analysis

Author: Hue Nguyen

0

View Report
Report Card

Coffee Brands Review Analysis

Author: Ishika Mondal Pore

0

View Report
Report Card

Global Coffee Roaster Review

Author: Joan Chukwuemeka

3

View Report
Report Card

Analysis of Coffee Producers and Roasters

Author: Luis Orozco

2

View Report
Report Card

FP20 Coffee Roasts Analysis

Author: Magdalena Koszczuk

27

View Report
Report Card

Coffee Roaster Review

Author: Mahsima Zarandi

8

View Report
Report Card

Coffee Roasters Analysis

Author: Maria Diaz

1

View Report
Report Card

Coffee Brands by Origin & Rating

Author: Miikka Karava

0

View Report
Report Card

Coffee Brands Review Analysis

Author: Onkar Bhise

25

View Report
Report Card

World Coffee Roaster Review Analysis

Author: Richard Mukechiwa

0

View Report
Report Card

Coffee Analysis Report

Author: Roberto Vallejos

14

View Report
Report Card

Coffee Roaster Review Analysis

Author: Ugochi Ugoala

2

View Report
Report Card

Coffee's Global Landscape: Production, Quality, and Regional Preferences

Author: Ugochukwu Nwasuruba

10

View Report
Report Card

Coffee Roaster Dataset Analysis

Author: Zulay Vivas

4

View Report

About FP20 Analytics ZoomCharts Challenge

Want to learn to build PRO reports? With personalized feedback and informative workshops, this is your opportunity to take your report-building skills to the next level, build your professional portfolio, and network with like-minded people.

The ZoomCharts challenge is hosted in partnership with FP20 Analytics – a group that unites passionate and inspiring data enthusiasts, and helps new data analysts improve their skills and build a competitive portfolio. Join in and sharpen your skills together with this open and friendly data community. Read more about the challenges on the FP20 Analytics website. Join the community on LinkedIn.

Participate in FP20 Analytics ZoomCharts Challenge to enrich your skill in creating PRO reports that help business users explore data quickly and intuitively. 

  1. Free License: All participants receive a free ZoomCharts Developer License that gives access to the full Drill Down PRO visuals library. License will remain active for 1 year after the challenge.
  2. Learn from Experienced Professionals: As part of the challenge, we host live workshops on report building and visualizing the challenge’s dataset in Power BI. Challenge participants can also book an individual consultation with an experienced Power BI mentor to ask questions and get personalized tips.
  3. Tailored Feedback: Every challenge submission will receive personalized feedback, giving participants the chance to hone their skills and improve their reports.

Prizes

The best report’s creator will receive a $300 Amazon gift card from ZoomCharts. The ZoomCharts winner will be announced in a special live webinar session on June 19, where we will review the top entries from the challenge. 

Webinar recordings

Recording thumbnail

Prepare Your Best Coffee Roaster Data Analysis with ZoomCharts

ZoomCharts online workshop for FP20 Analytics Challenge 16 participants

Watch the recording
Recording thumbnail

Reviewing ZoomCharts TOP 5: Challenge 16 Finalists

Best FP20 Analytics ZoomCharts Challenge 16 submissions + announcing the winner

Watch the recording

How to participate? 

1. Register for the challenge: 

  • Download the Challenge dataset either on this Challenge page or from FP20 Analytics website. 
  • Register for the FP20 Analytics ZoomCharts Challenge. 
  • Activate your free Drill Down Visuals Developer License for Power BI.
  • Read the challenge brief (see "The Brief" section) for additional info about the dataset and to see what questions your report should answer.  

2. Build your report in Power BI: 

  • Set up an account in Power BI using the assigned license details (if you have participated in ZoomCharts Challenges in the past, you can use the same account you set up before).
  • Use the account to access the full library of custom ZoomCharts Drill Down visuals. 
  • Use the dataset to build a Power BI report including at least 2 ZoomCharts Drill Down Visuals in one report page. 
  • Reports are restricted to a maximum of 2 pages. 

3. Improve your report and learn new skills: 

  • To learn more about applying ZoomCharts visuals in your reports, participate in the challenge workshop. 
  • If you have any questions or need advice, you can book a free individual consultation. 
  • Check out the submissions from past challenges for inspiration. 

4. Submit your challenge entry: 

  • Submit your report in .pbix format for validation. 
  • If your submission doesn’t match the challenge criteria, you will be notified by email indicating the reason. Don't worry if this happens! You can fix the issue and resubmit your report. 
  • Together with validation confirmation, you will receive a publish to web link that you can use to add the report to your portfolio or publicly share online. 
  • All validated entries will receive personalized feedback from the evaluation team. You can use this feedback to revise your report and resubmit it before the deadline. Feel free to resubmit your entry as many times as necessary before the deadline. 

5. Finalize your participation to compete for the ZoomCharts grand prize: 

  • (Optional) Upload your publish to web link on NovyPro.  If you opt to post your report on NovyPro, for instructions on how to do this, refer to the video link provided. NovyPro: https://www.novypro.com/  
    Instruction Video: https://www.youtube.com/watch?v=jkcAYgFGWUY
  • Post the final version of your submission in PDF format on your LinkedIn profile. 
  • Use the caption "I am participating in FP20 Analytics Challenge 16”. 
  • Include a summary of your report's key insights and add the ZoomCharts publish to web link or NovyPro link. 
  • Use the hashtags #FP20Analytics, #FP20AnalyticsCoffeeAnalysis, #builtwithzoomcharts, tag @Federico Pastor and @Zoomcharts. 
  • Additionally, post your report in the FP20 Analytics LinkedIn Community group. 
  • Follow ZoomCharts on LinkedIn 

6. Attend challenge closing webinar to hear the results: 

  • The submissions are evaluated by ZoomCharts team (see "Judging criteria" for more info). The submissions of Top 5 ZoomCharts Mini Challenge finalists are analyzed live during the challenge closing webinar to share the best practices and learning opportunities with the community. 
  • The author of the best report is awarded with a $300 Amazon gift card.

About the dataset

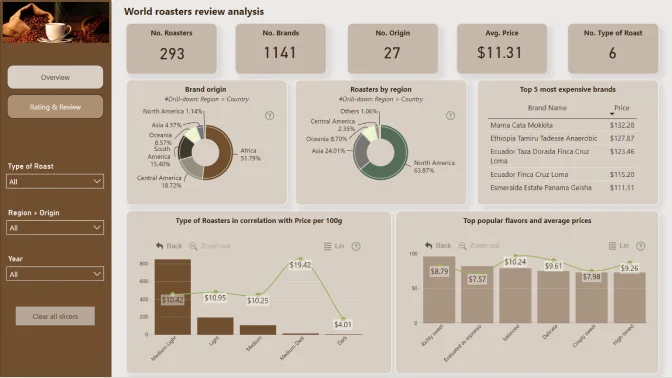
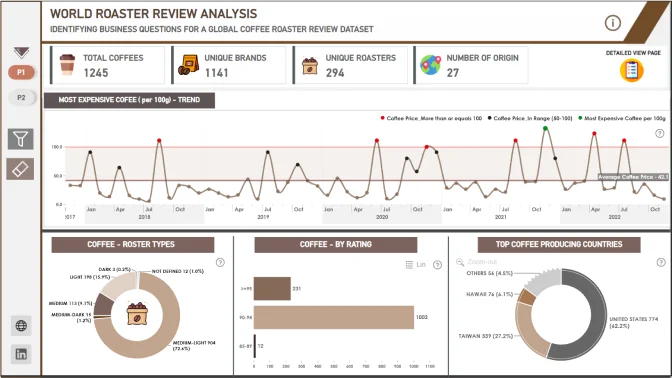
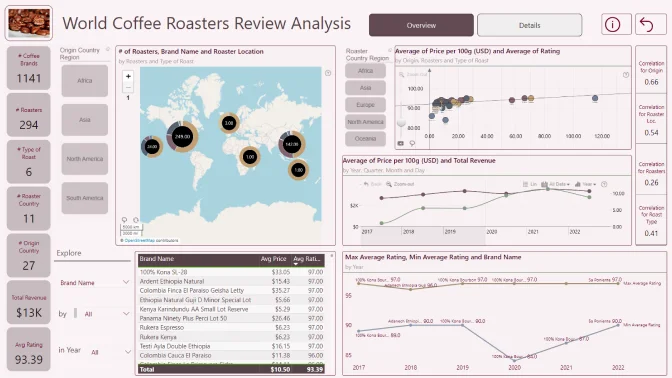
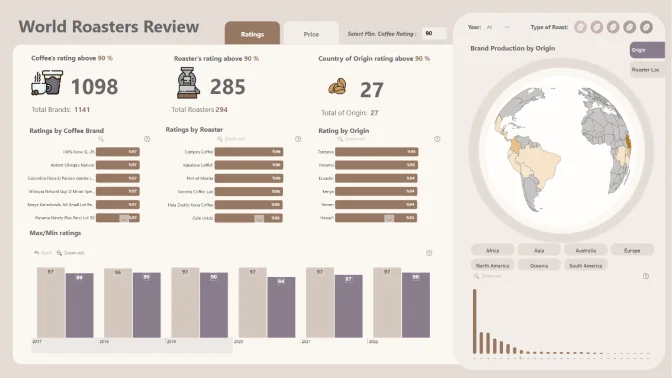
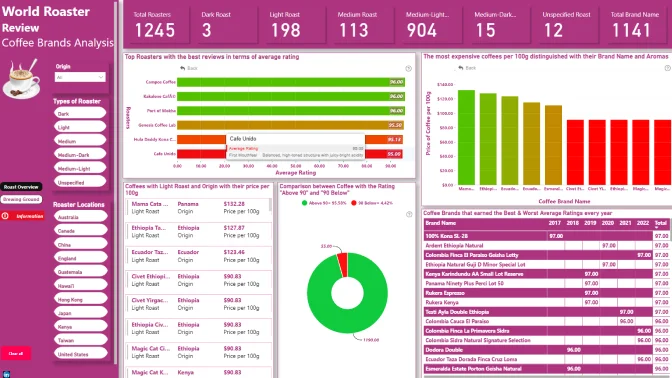
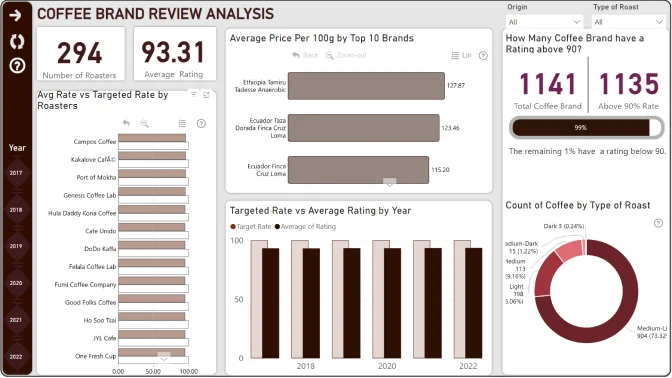
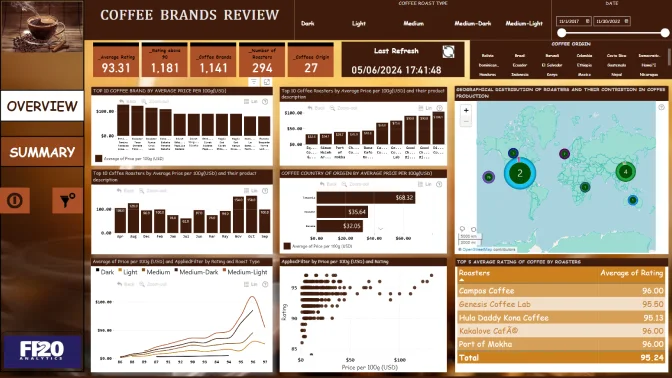
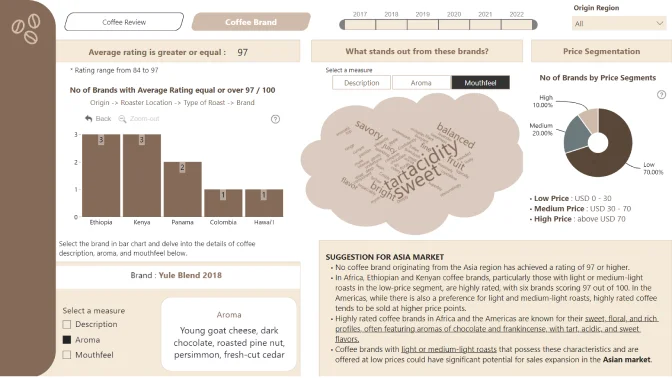
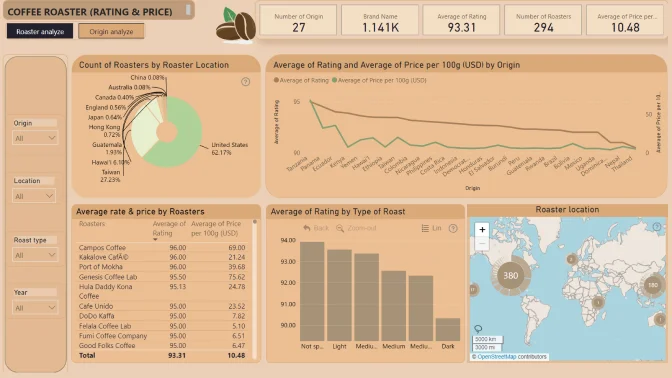
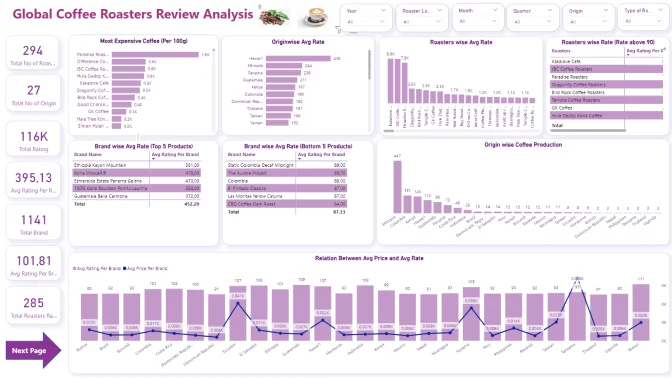
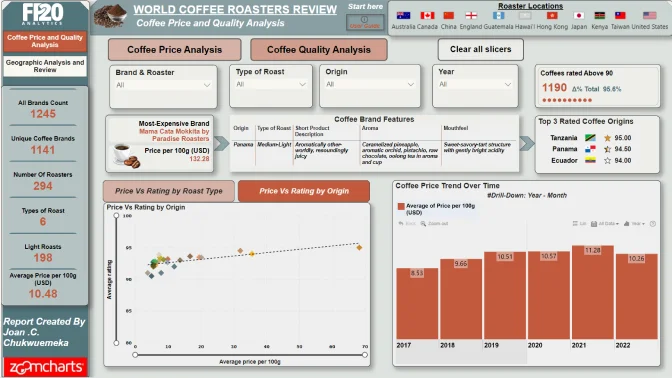
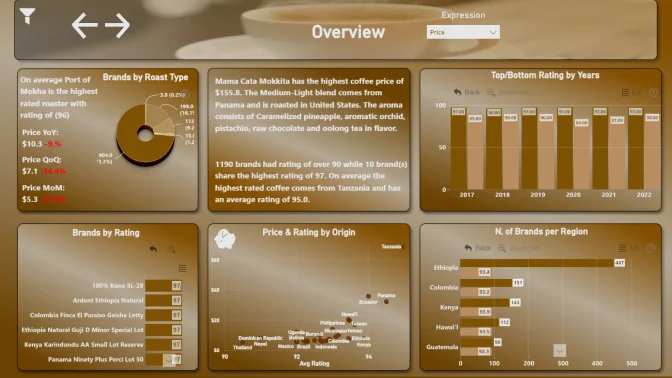
For many of us, a cup of coffee is an integral part of the day. But how much do we really know about the intricacies of coffee production? This challenge dives into the world of coffee roasters to uncover hidden trends and intriguing insights. Prepare to explore a rich dataset brimming with information about coffee origins, roasts, prices, ratings, and more.

What should your report include?

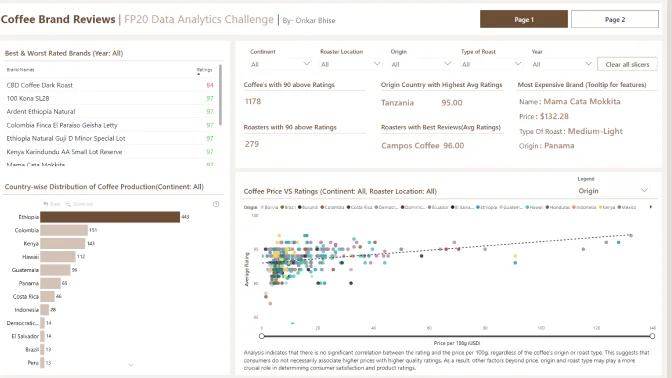
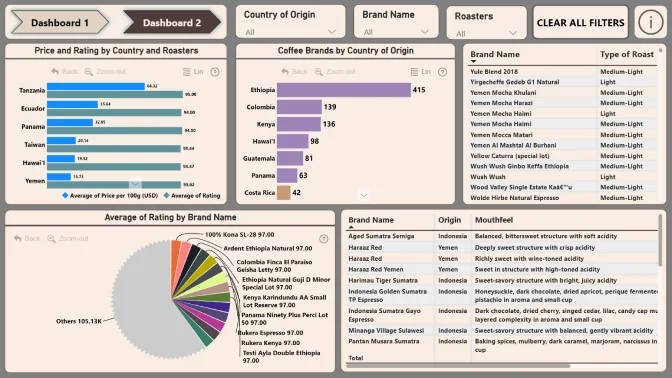
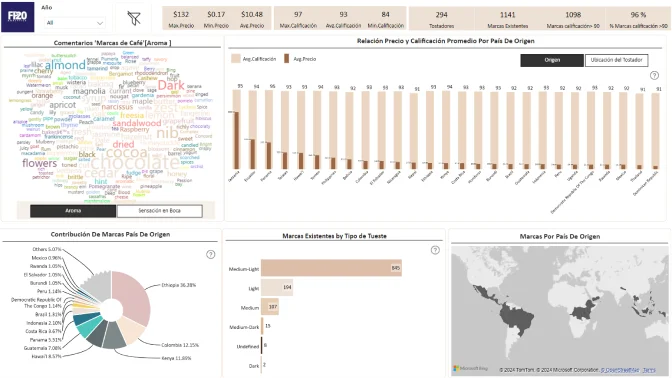
Create a report that allows end users to easily find answers to the following questions:

  1. What is the most expensive coffee per 100g, and what features distinguish it?
  2. Which country of origin has the highest average rating for coffee?
  3. Which coffee brand has the best/worst average rating every year?
  4. Which roaster has received the best reviews in terms of average rating?
  5. How many coffees have a rating above 90?
  6. Which coffee has a “light” roast?
  7. Which country contributes the most to the dataset in terms of coffee production?
  8. Is there any relationship between the price of coffee and its rating, considering different origins and roast?
  9. In North America (Roaster location), show a word cloud visual of their coffee’s Aroma.
  10. Top 5 high average rating coffee brands in Asia, do they have a common Mouthfeel? Provide recommendations for future Asian markets.

Technical requirements

  • Build your report using only Power BI 
  • Reports are restricted to a maximum of 2 pages 
  • Canvas size is 16:9 (Default Power BI size) or Full HD size = w:1920 - h:1080 
  • The report should contain at least 2 ZoomCharts Drill Down visuals within a single page. See a practical guide for using Drill Down visuals here

Judging criteria

Business users use reports to make data-driven decisions. That’s why reports are called effective if they enable users to drill down and filter data quickly and intuitively to find answers to any question they might have and analyse data in all possible directions and dimensions. We will evaluate:

  1. How easy is it to understand the data? (max 10 points)
    • Is too much text used for explanation?
    • Are the indicative colors in charts instinctually understandable?
    • Does it tell a story?
  2. How easy-to-use is the report? (max 14 points)
    • Cross-chart filtering implementation across the report. Can other visuals provide relevant data as the user explores the report?
    • Response time
    • Drill Down: multi-layer data exploration. Can the user drill down and gain additional insights within the report?
    • Use of tutorial overlays and other elements to assist new users. Can a new user start using this report straight away with just the guidance provided within the report itself?
  3. How good is the report design and is it suitable for its purpose? (max 10 points)
    • Visual design: is the overall look consistent, no empty spaces, no overcrowding?
    • Interface design: are there unnecessary visualisations/buttons/complexity in use?
    • UX design: is the produced report usable?
    • Report design: is the main challenge answered?
    • Technical: are all the fonts used the same, are the sizes readable?

You are encouraged to use various techniques at your disposal, such as tooltips, drill-throughs, drill-downs, cross-chart filtering and page navigation features, to enhance your analysis.

Timeline

Registration Open

Registration Open

13 May | 21:00

-

Submissions Open

Submissions Open

13 May | 21:00

-

Workshop | Prepare Your Best Coffee Roaster Data Analysis with ZoomCharts

Workshop | Prepare Your Best Coffee Roaster Data Analysis with ZoomCharts

23 May | 11:30

-

1:1 Mentoring Sessions

1:1 Mentoring Sessions

23 May | 11:30

13 May - 12 June

Entry Submission Deadline

Entry Submission Deadline

12 June | 21:00

13 May - 12 June

Webinar | Reviewing ZoomCharts TOP 5: Challenge 16 Finalists

Webinar | Reviewing ZoomCharts TOP 5: Challenge 16 Finalists

19 June | 11:00

13 May - 12 June

Winner Announced

Winner Announced

19 June | 11:00

13 May - 12 June

Dataset

Get the dataset

See past FP20 Analytics May 2024 challenges

See past challenges

Your Drill Down Visuals Developers License

Use the email and password provided below to log in Power BI Desktop and access an account with a license to use all ZoomCharts Drill Down Visuals.

Upon logging in, you will need to change your password and enable two-factor authentication. If you encounter any problems, feel free to reach out to us via chat.

*This Developer License can be used to create a report for this ZoomCharts Mini Challenge or for your personal training purposes. Commercial use of this license is prohibited.

Upload failed
Attach file
File requirements: 16MB

Any questions? Feel free to use chat!

Are you sure you want to delete the report?

Activate your Drill Down visuals Developer License!

You can use these credential to access ZoomCharts visuals and create your report for this ZoomCharts Mini Challenge, or for your personal training purposes.


logo
[email protected]
+44 204 577 3993
logo

Products

Drill Down Network PRO Drill Down Waterfall PRO Drill Down Graph PRO Drill Down Combo PRO Drill Down Combo Bar PRO Drill Down Donut PRO Drill Down Pie PRO Drill Down TimeSeries PRO Drill Down Timeline PRO Drill Down Map PRO Drill Down Scatter PRO All Visuals

Resources

Report Examples Webinars Blog ZoomCharts Academy Visuals Gallery Documentation Custom Visual Development Subscribe to News

Solutions

Custom Visual Development

Company

Pricing About Us Partners Leave feedback Join PowerGroup EU Funding

Help

ZoomCharts Assistance Contact Sales Contact Support FAQ

Drill Down Network PRO Drill Down Waterfall PRO Drill Down Graph PRO Drill Down Combo PRO Drill Down Combo Bar PRO Drill Down Donut PRO Drill Down Pie PRO Drill Down TimeSeries PRO Drill Down Timeline PRO Drill Down Map PRO Drill Down Scatter PRO All Visuals

Report Examples Webinars Blog ZoomCharts Academy Visuals Gallery Documentation Custom Visual Development Subscribe to News

Custom Visual Development

Pricing About Us Partners Leave feedback Join PowerGroup EU Funding

ZoomCharts Assistance Contact Sales Contact Support FAQ
+44 204 577 3993
[email protected]

Ready to get in touch?

Contact our experts with any question about Power BI and ZoomCharts for Free!

Contact us

© 2025, Data Visualization Software Lab

U.S. Patents No. 11,645,343; 11,921,804

Cookies Policy
Manage cookies
Privacy Policy
Global
EULA
Patent
warning

Error message

success

Success info: Done!

ZoomCharts AI Assistant

We noticed you're using an old OS version.

For the best experience, we recommend upgrading to ensure that all website features display correctly.

Cookie settings

We use necessary cookies for site functionality, as well as statistic, marketing, and preference cookies to enhance your experience. For more information and to manage your preferences, please visit our Cookie policy