521
Coffee Roaster Analysis
Coffee Roaster Analysis
Report Author: Norman Reynaldo Sabillon Castro
521
Share template with others
Report submitted for FP20 Analytics ZoomCharts Challenge 16 (May 2024). The report was built with the Coffee Roaster Dataset and includes ZoomCharts custom Drill Down PRO visuals for Power BI.
Author's description:
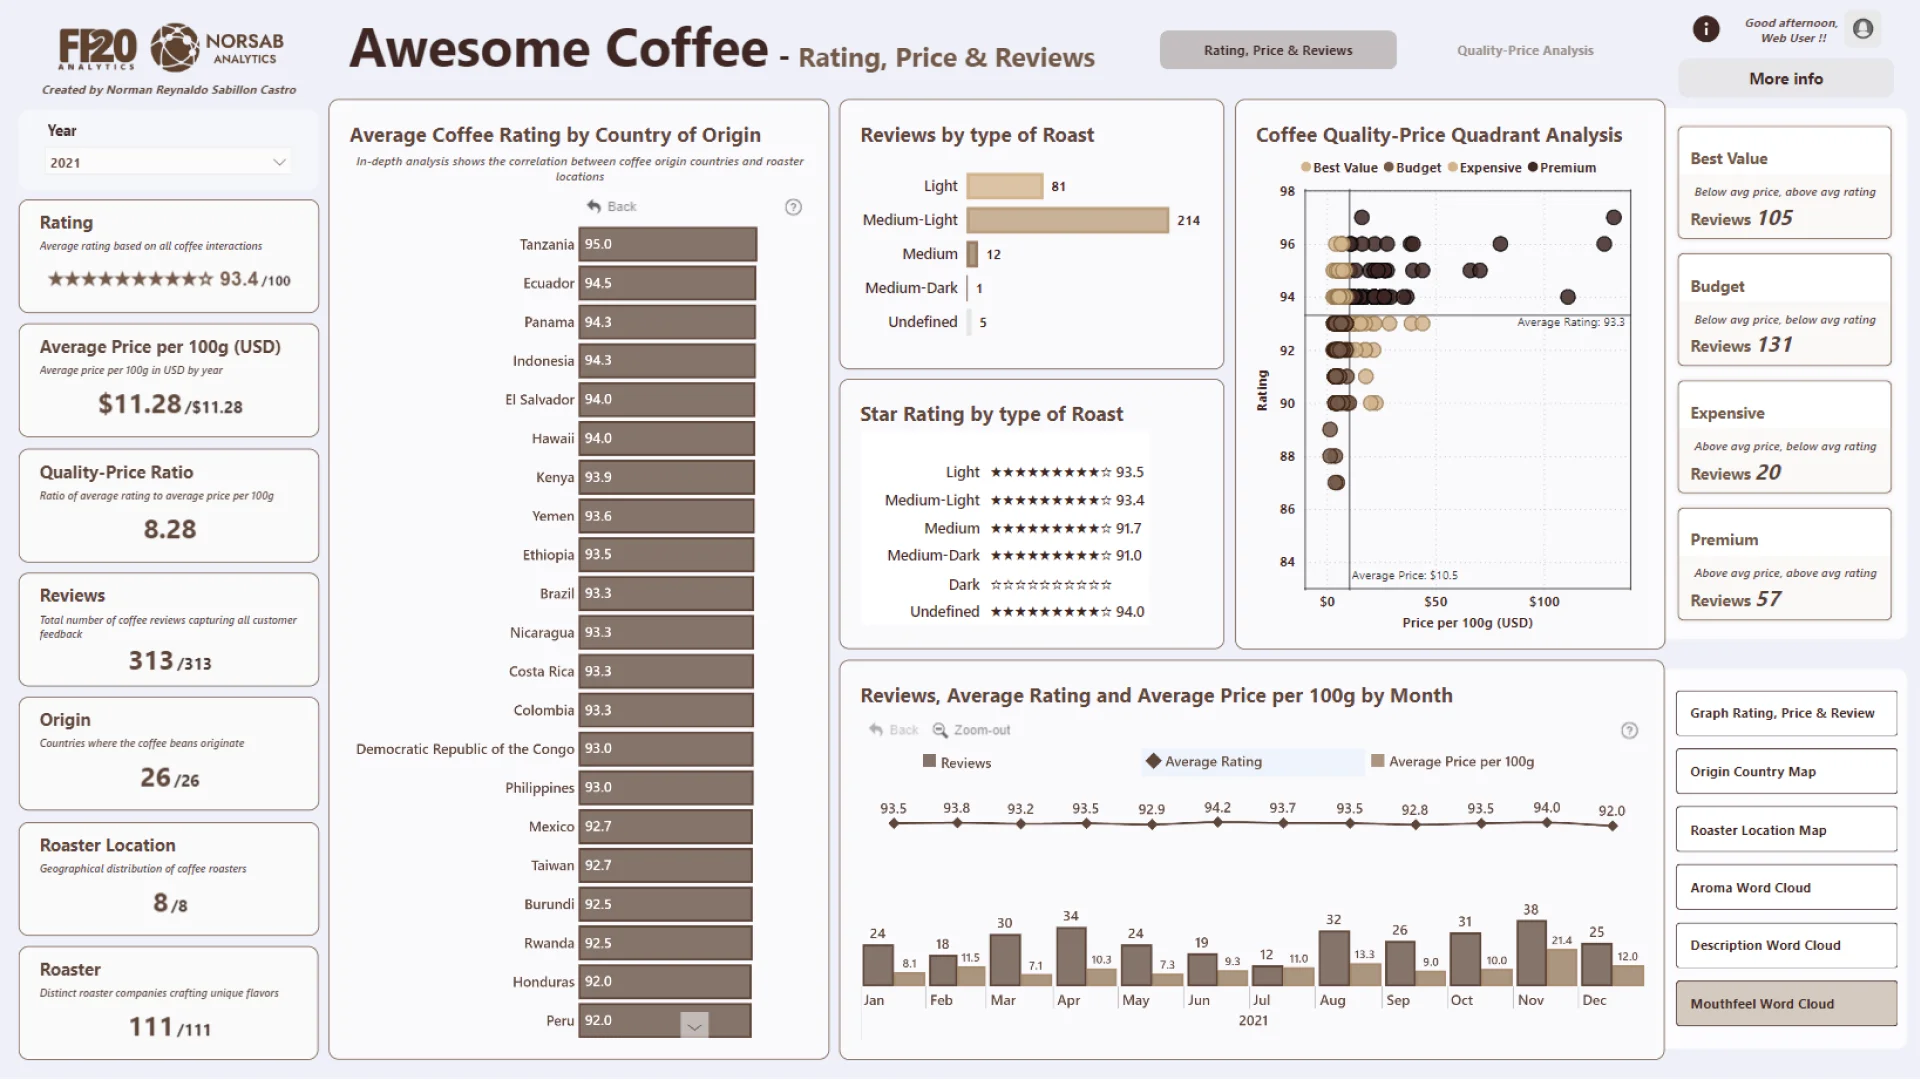
Awesome Coffee is a comprehensive analytical solution designed to provide in-depth insights into the quality, pricing, and reviews of various coffee brands. Created by Norman Reynaldo Sabillon Castro in 2024, this solution is divided into three key pages:
Rating, Price & Reviews: This page presents a detailed overview of coffee ratings, average prices per 100g in USD, and customer reviews. Key indicators include the overall average rating, the quality-price ratio, and the total number of reviews. Visualizations such as bar charts and star ratings by type of roast provide a clear picture of coffee performance across different categories.
Quality-Price Analysis: This page focuses on identifying the best brands, origin countries, roasters, and roaster locations based on an optimal quality-to-price ratio. By dividing the average rating by the average price per 100g, we highlight the top performers in each category, helping to understand which coffees offer the best value for money.
Information about Coffee Reviews: This detailed page provides granular data about coffee reviews, including continent of origin, country of origin, roaster location, specific roasters, and sensory attributes like aroma, description, and mouthfeel. It also includes review dates, brand names, types of roast, quadrant classifications, ratings, and prices per 100g. This allows for a thorough examination of the factors influencing coffee quality and consumer preferences.
Key Metrics:
- Average Rating: Displays the average customer rating for each coffee.
- Average Price per 100g (USD): Shows the average price of coffee per 100 grams.
- Quality-Price Ratio: Calculated by dividing the average rating by the average price per 100 grams, indicating the value for money.
- Total Reviews: Counts the total number of coffee reviews.
- Distinct Aromas, Descriptions, and Mouthfeels: Counts of unique sensory attributes captured in the reviews.
Insights:
- Top Performing Brands and Origins: Identification of brands and countries with the highest quality-price ratios, indicating the best value coffees.
- Consumer Preferences: Analysis of common aromas, descriptions, and mouthfeel characteristics preferred by consumers.
- Geographical Trends: Insights into the geographical distribution of high-rated coffee roasters and origins.
- Price Sensitivity: Understanding how pricing impacts consumer ratings and identifying the sweet spot for optimal pricing strategies.
- Roast Types: Performance comparison of different roast types based on ratings and reviews.
By leveraging this solution, stakeholders can gain valuable insights into market trends, identify high-performing coffee brands, and make informed decisions based on robust analysis of quality and pricing metrics.
Additional Features: To enhance the user experience, a guided tour has been created for the first page, ensuring users can easily navigate and understand the key elements of the dashboard. Additionally, a welcome page introduces the Awesome Coffee dashboard, setting the stage for a deep dive into coffee analytics.
4U Report Challenges
Participate in data challenges, build and submit reports to get free template downloads.
Join CommunityMobile view allows you to interact with the report. To Download the template please switch to desktop view.


Was this helpful? Thank you for your feedback!
Sorry about that.
How can we improve it?