logo
For Power BI
  • Products
    • Drill Down Donut Pro Drill Down Donut PRO
    • Drill Down Pie Pro Drill Down Pie PRO
    • Drill TimeSeries Pro Drill Down TimeSeries PRO
    • Drill Combo Pro Drill Down Combo PRO
    • Drill Map Pro Drill Down Map PRO
    • Drill Scatter Pro Drill Down Scatter PRO
    • Drill Down Network Pro Drill Down Network PRO
    • Drill Down Waterfall Pro Drill Down Waterfall PRO
    • Drill Down Graph Pro Drill Down Graph PRO
    • Drill Down Timeline Pro Drill Down Timeline PRO
    • Drill Down Combo Bar PRO Drill Down Combo Bar PRO
    • Drill Down Line PRO Drill Down Line PRO

    Video tutorials

    Watch Now

    More than 90 videos on how to enhance Power BI with ZoomCharts

    Learn more
    All visuals
  • Resources

      Resources

    • Documentation
    • Report Examples
    • Blog
    • Webinars
    • Video Tutorials
    • Visuals Gallery

    Support

    • ZoomCharts Assistance
    • Contact Sales
    • Contact Support
    • FAQ

    Challenges

    Challenges

    Improve your report creation skills by participating in free challenges for report creators.

    Learn more
    Start trial
  • Services
    • Power BI Report Development
    • Custom Visual Development
  • Challenges
  • Pricing
Request a quote Start Free Book a Demo Sign in
Get it now
Go back

Contents

Go back

Jul 01, 2022

Microsoft Integrates ZoomCharts in Dynamics 365 Supply Chain Insights

We are excited to announce the collaboration between Microsoft’s latest product – Dynamics 365 Supply Chain Insights – and technologies provided by ZoomCharts – the Network and Map visuals.
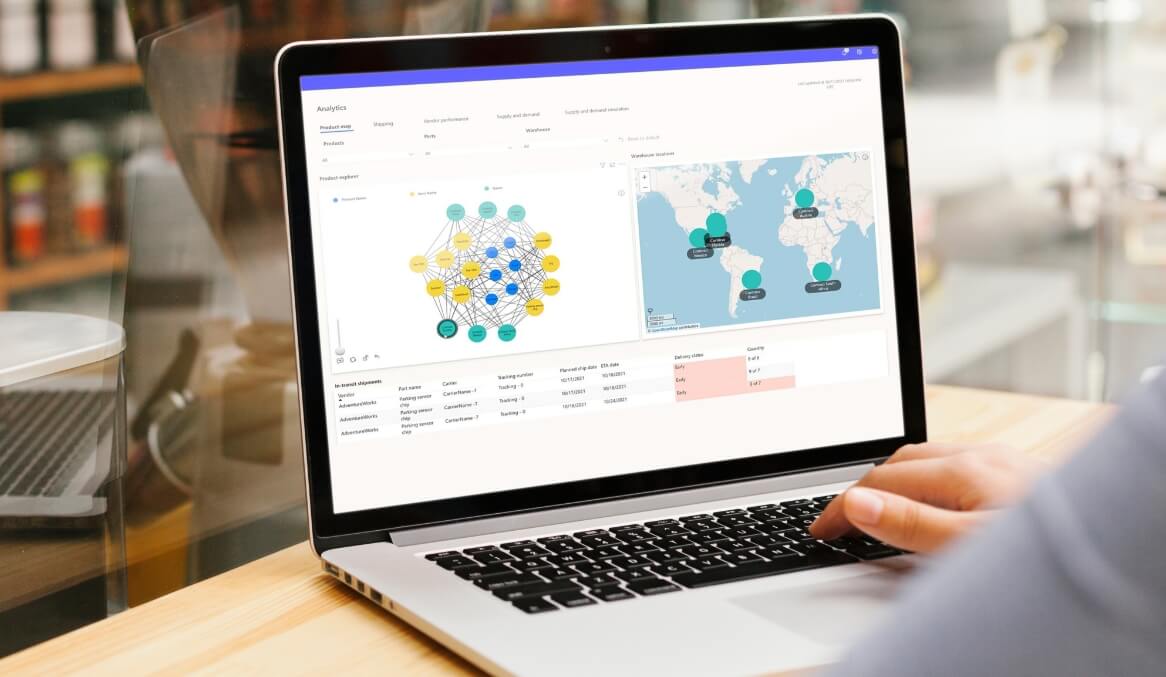
Title image
Title image

We are excited to announce the collaboration between Microsoft’s latest product – Dynamics 365 Supply Chain Insights – and technologies provided by ZoomCharts – the Network and Map visuals.

Contents

Share this article

Dynamics 365 Supply Chain Insights Reinforces Supply Chains

Microsoft’s Dynamics 365 Supply Chain Insights was built using the Power platform and attempts to tackle the problems associated with supply chain disruptions due to unprecedented risks and interferences.

By creating a digital twin of a supply chain, companies enable themselves to create a transparent supply chain system that can withstand, predict, and work around any radical changes in supply and demand, thus avoiding any disruptions that could potentially result in major economic losses. 

ZoomCharts's Custom Visuals for Power BI in Action

Microsoft incorporated the Network and Map visuals after reaching out to ZoomCharts to act as one of the select major tools within the Product Analytics Dashboard tab of Dynamics 365 Supply Chain Insights. These visuals work side by side, letting the user see what productions they have stationed in which areas, and help with shifting their production plans between manufacturers, thus avoiding any unnecessary losses.
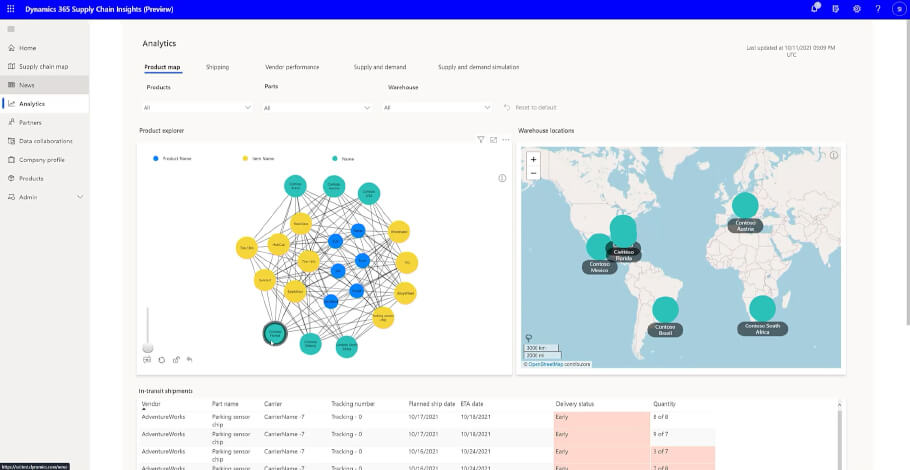
Dynamics 365 Supply Chain Insights Power BI

The Network and Map visuals work seamlessly in allowing the user to find solutions to production plan disturbances and help avoid any potential risks proposed by the provided news sources and third-party insurers.

The Next Step in Supply Chain Digitization

Using the insights gathered by the Product Analytics Dashboard, companies can take optimal action and collaborate with their suppliers, logistics partners, and internal stakeholders. 

Dynamics 365 Supply Chain Insights combined with the technology of ZoomCharts is a notable step in the way of speeding up the necessary process of supply chain digitization. 

ZoomCharts Drill Down Visuals are known for their interactive drill downs, smooth animations, and rich customization options that help data analysts and enthusiasts achieve the full potential of their operations by unlocking key insights within their data. 

Video excerpt from official launch:

See full video here!  

Visit our product pages to evaluate Drill Down Map PRO and Drill Down Network PRO!

envelope icon

Want more info like this?

Subscribe to our newsletter and be the first to read our latest articles and expert data visualization tips!

Find out more

Oct 18, 2022

Blog Thumbnail
Guides

Create a Power BI Org Chart & More with Drill Down Graph PRO

Drill Down Graph PRO is one of our most advanced data visualization tools, and in this article, we will explore the many ways you can use it in your Power BI reports, including org charts, AML graphs and more. Furthermore, we will go through some tips & tricks on how to create graphs in Power BI with this powerful visual.

Jun 12, 2022

Blog Thumbnail
Guides

Power BI Waterfall Charts: A Detailed Guide

Do you know how to make a waterfall chart? Here are 7 tips you should know when building user friendly Power BI waterfall charts. Customize it to tell a data story that helps you make data driven decisions. Bar and column charts work great for visualizing a beginning and ending value. However, these charts fail to display the full data story by leaving out all the unique factors that contribute to a final net value. In this article, we will look at the basics of waterfall charts and what practices you can implement to build the best waterfall charts in Power BI.

Jul 01, 2022

Blog Thumbnail
Use cases

Microsoft Integrates ZoomCharts in Dynamics 365 Supply Chain Insights

We are excited to announce the collaboration between Microsoft’s latest product – Dynamics 365 Supply Chain Insights – and technologies provided by ZoomCharts – the Network and Map visuals.

Feb 14, 2022

Blog Thumbnail
Guides

Everything You Need To Know About Power BI Bar Charts

Power BI bar charts are a simple and efficient way to show category-based data. Almost everyone has used a bar chart, which is why they've remained incredibly popular through the years. In this article, we will explore the many ways you can make Power BI bar charts even more powerful and use them to the max.

Dec 16, 2021

Blog Thumbnail

How We Turned Many Excel Files Into an Interactive Power BI Report about Latvia’s Export landscape

How We Turned an Excel Sheet Into an Interactive Report: Latvia Export Barometer. ZoomCharts took part in a widescale project that created a full report of...

Sep 04, 2022

Blog Thumbnail
Guides

Power BI Donut Chart

The donut and pie charts are some of the most ubiquitous charts around. Instantly recognizable by people who have very little to do with charts, every report creator is bound to have to include a Power BI donut chart into a report at some point. This is not a commentary on whether you should love or hate donut charts, but rather a guide on getting the most out of donut and pie charts. Strap in tight, we're going to go over the whys, hows, do's and don'ts of Power BI donut charts.
  • «
  • 1
  • ...
  • 5
  • 6
  • 7
  • 8
  • 9
  • 10
  • 11
  • »

Contents

Share this article

Want more info like this?

Subscribe to our newsletter and be the first to read our latest articles and expert data visualization tips!


Thank you!

Check your inbox to verify your email address.

logo
[email protected]
+44 204 577 3993
logo

Products

Drill Down Network PRO Drill Down Waterfall PRO Drill Down Graph PRO Drill Down Combo PRO Drill Down Combo Bar PRO Drill Down Donut PRO Drill Down Pie PRO Drill Down TimeSeries PRO Drill Down Timeline PRO Drill Down Map PRO Drill Down Scatter PRO All Visuals

Resources

Report Examples Webinars Blog ZoomCharts Academy Visuals Gallery Documentation Custom Visual Development Subscribe to News

Solutions

Custom Visual Development

Company

Pricing About Us Partners Leave feedback Join PowerGroup EU Funding

Help

ZoomCharts Assistance Contact Sales Contact Support FAQ

Drill Down Network PRO Drill Down Waterfall PRO Drill Down Graph PRO Drill Down Combo PRO Drill Down Combo Bar PRO Drill Down Donut PRO Drill Down Pie PRO Drill Down TimeSeries PRO Drill Down Timeline PRO Drill Down Map PRO Drill Down Scatter PRO All Visuals

Report Examples Webinars Blog ZoomCharts Academy Visuals Gallery Documentation Custom Visual Development Subscribe to News

Custom Visual Development

Pricing About Us Partners Leave feedback Join PowerGroup EU Funding

ZoomCharts Assistance Contact Sales Contact Support FAQ
+44 204 577 3993
[email protected]

Ready to get in touch?

Contact our experts with any question about Power BI and ZoomCharts for Free!

Contact us

© 2025, Data Visualization Software Lab

U.S. Patents No. 11,645,343; 11,921,804

Cookies Policy
Manage cookies
Privacy Policy
Global
EULA
Patent
warning

Error message

success

Success info: Done!

ZoomCharts AI Assistant

We noticed you're using an old OS version.

For the best experience, we recommend upgrading to ensure that all website features display correctly.

Cookie settings

We use necessary cookies for site functionality, as well as statistic, marketing, and preference cookies to enhance your experience. For more information and to manage your preferences, please visit our Cookie policy