logo
For Power BI
  • Products
    • Drill Down Donut Pro Drill Down Donut PRO
    • Drill Down Pie Pro Drill Down Pie PRO
    • Drill TimeSeries Pro Drill Down TimeSeries PRO
    • Drill Combo Pro Drill Down Combo PRO
    • Drill Map Pro Drill Down Map PRO
    • Drill Scatter Pro Drill Down Scatter PRO
    • Drill Down Network Pro Drill Down Network PRO
    • Drill Down Waterfall Pro Drill Down Waterfall PRO
    • Drill Down Graph Pro Drill Down Graph PRO
    • Drill Down Timeline Pro Drill Down Timeline PRO
    • Drill Down Combo Bar PRO Drill Down Combo Bar PRO
    • Drill Down Line PRO Drill Down Line PRO

    Video tutorials

    Watch Now

    More than 90 videos on how to enhance Power BI with ZoomCharts

    Learn more
    All visuals
  • Resources

      Resources

    • Documentation
    • Report Examples
    • Blog
    • Webinars
    • Video Tutorials
    • Visuals Gallery

    Support

    • ZoomCharts Assistance
    • Contact Sales
    • Contact Support
    • FAQ

    Challenges

    Challenges

    Improve your report creation skills by participating in free challenges for report creators.

    Learn more
    Start trial
  • Services
    • Power BI Report Development
    • Custom Visual Development
  • Challenges
  • Pricing
Request a quote Start Free Book a Demo Sign in
Get it now
Go back

Contents

Go back

Dec 16, 2021

How We Turned Many Excel Files Into an Interactive Power BI Report about Latvia’s Export landscape
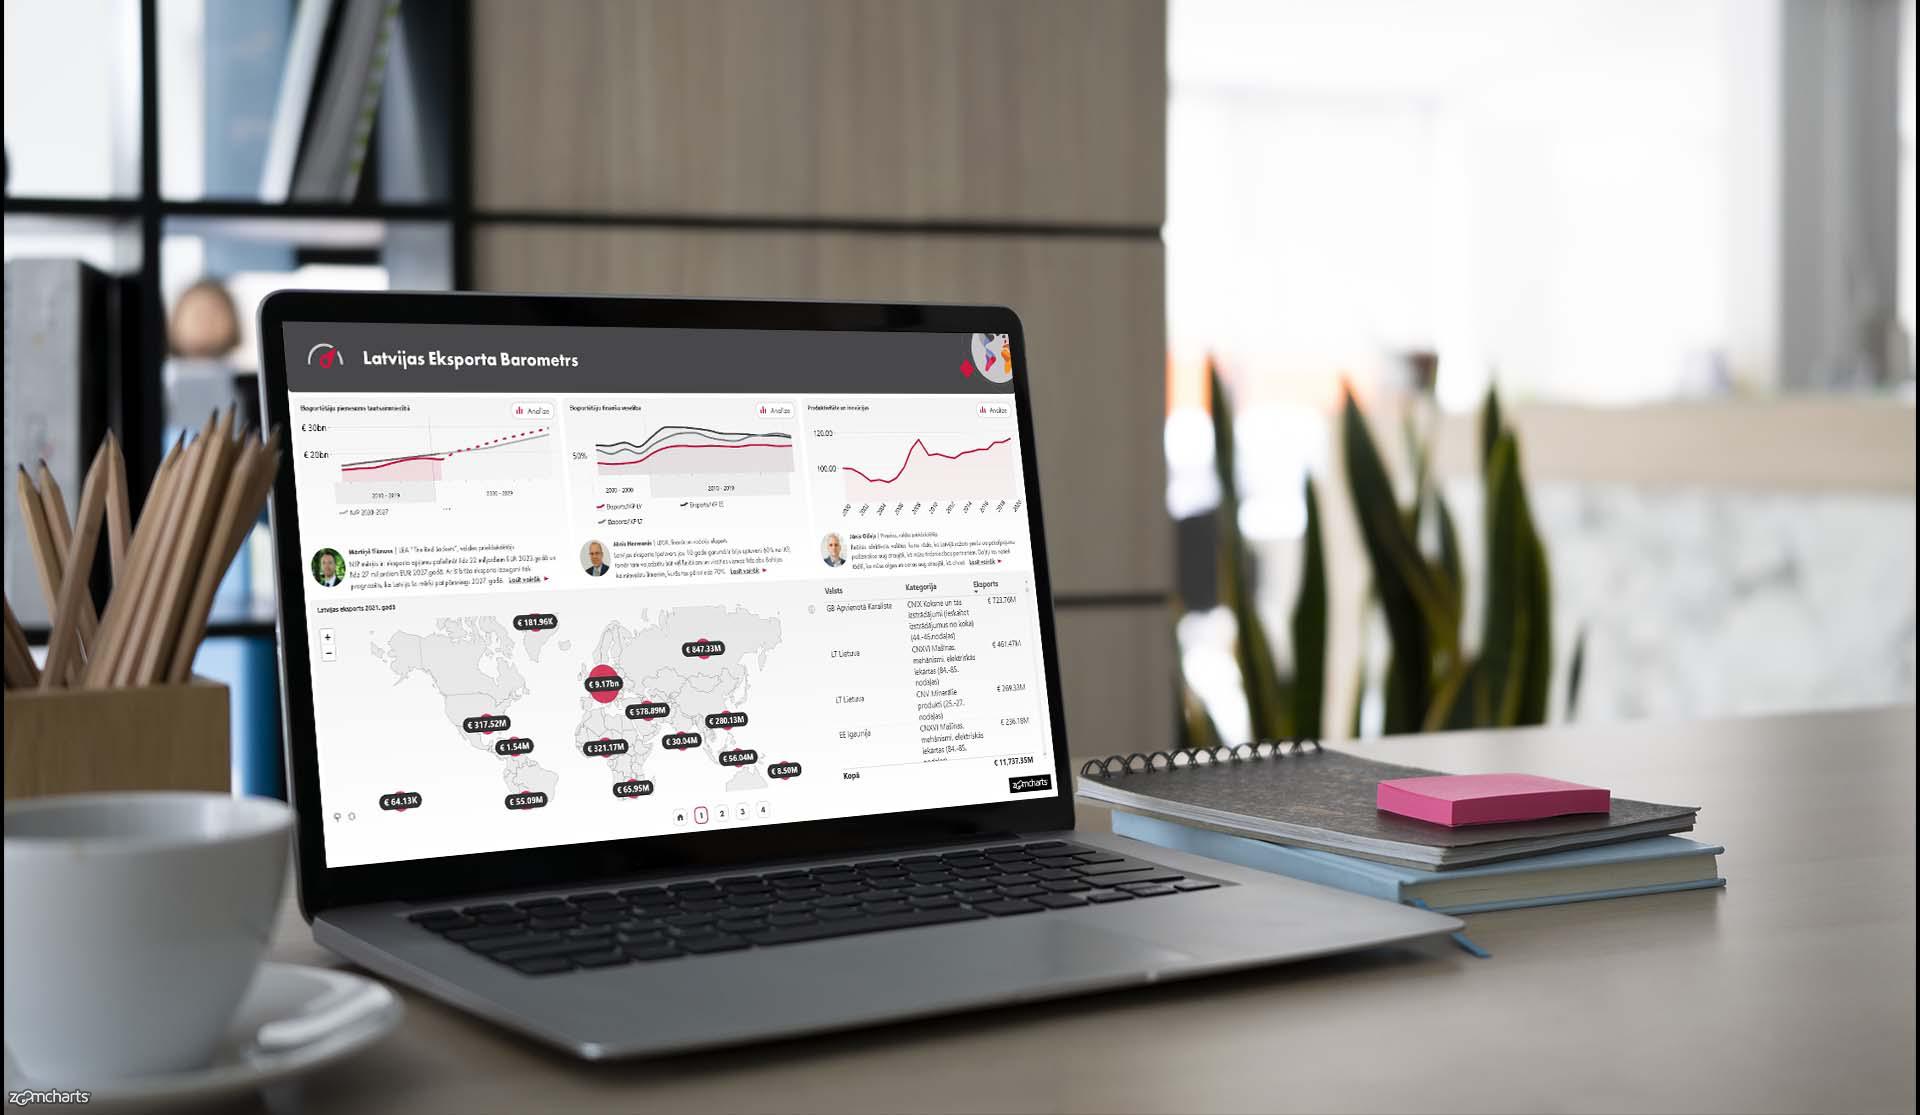
How We Turned an Excel Sheet Into an Interactive Report: Latvia Export Barometer. ZoomCharts took part in a widescale project that created a full report of...
Title image
Title image
How We Turned an Excel Sheet Into an Interactive Report: Latvia Export Barometer. ZoomCharts took part in a widescale project that created a full report of...

Contents

Share this article

How We Turned an Excel Sheet Into an Interactive Report: Latvia Export Barometer.


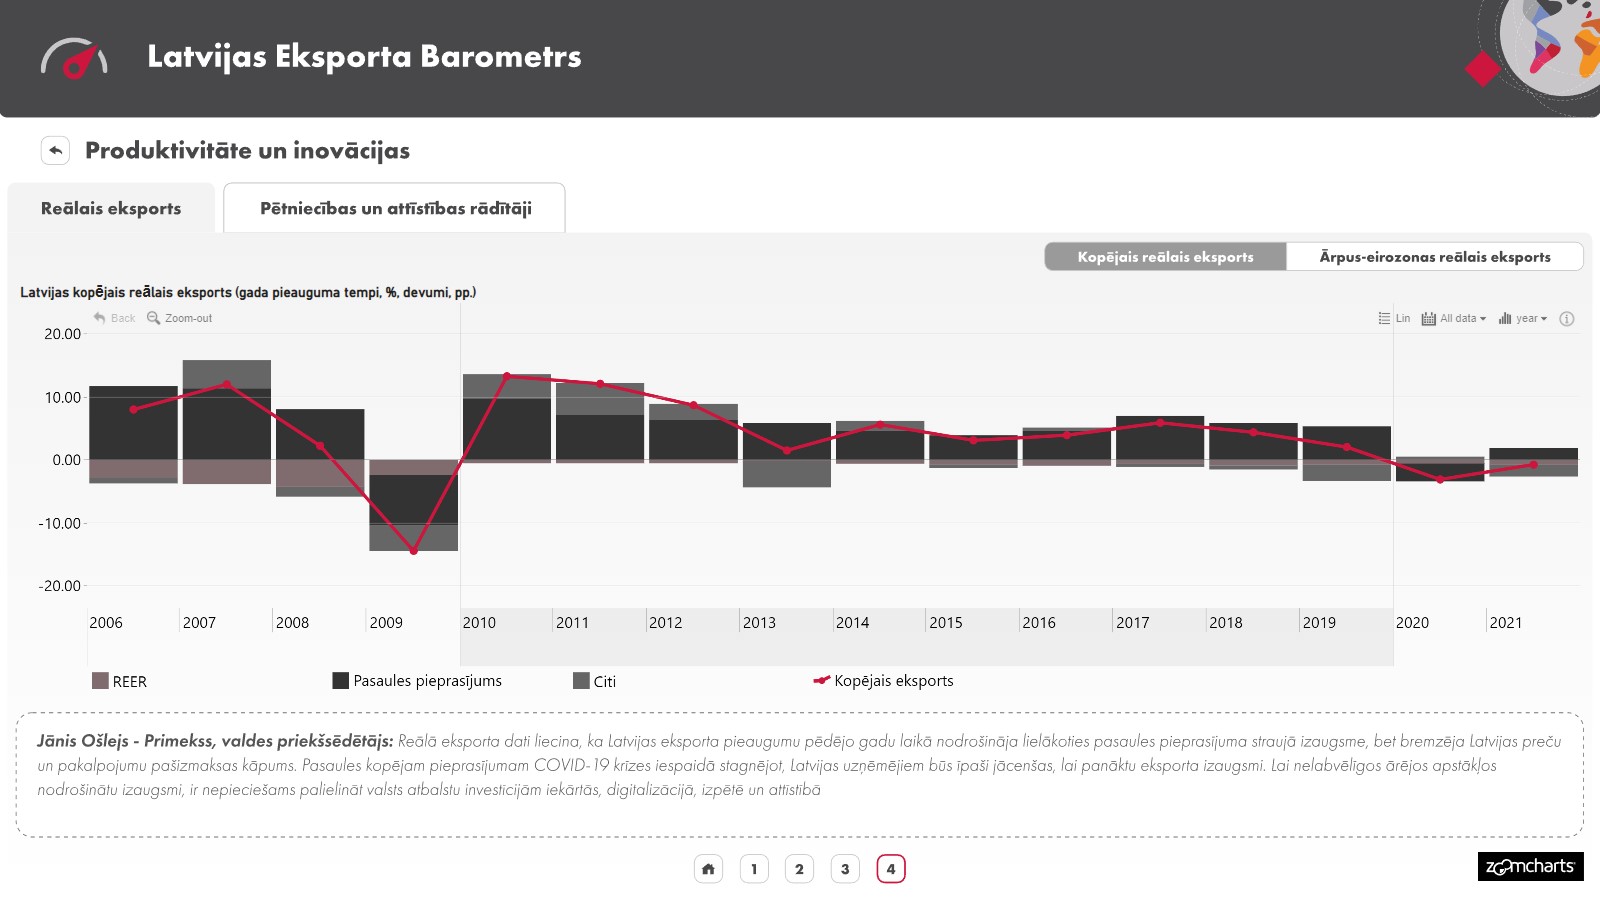
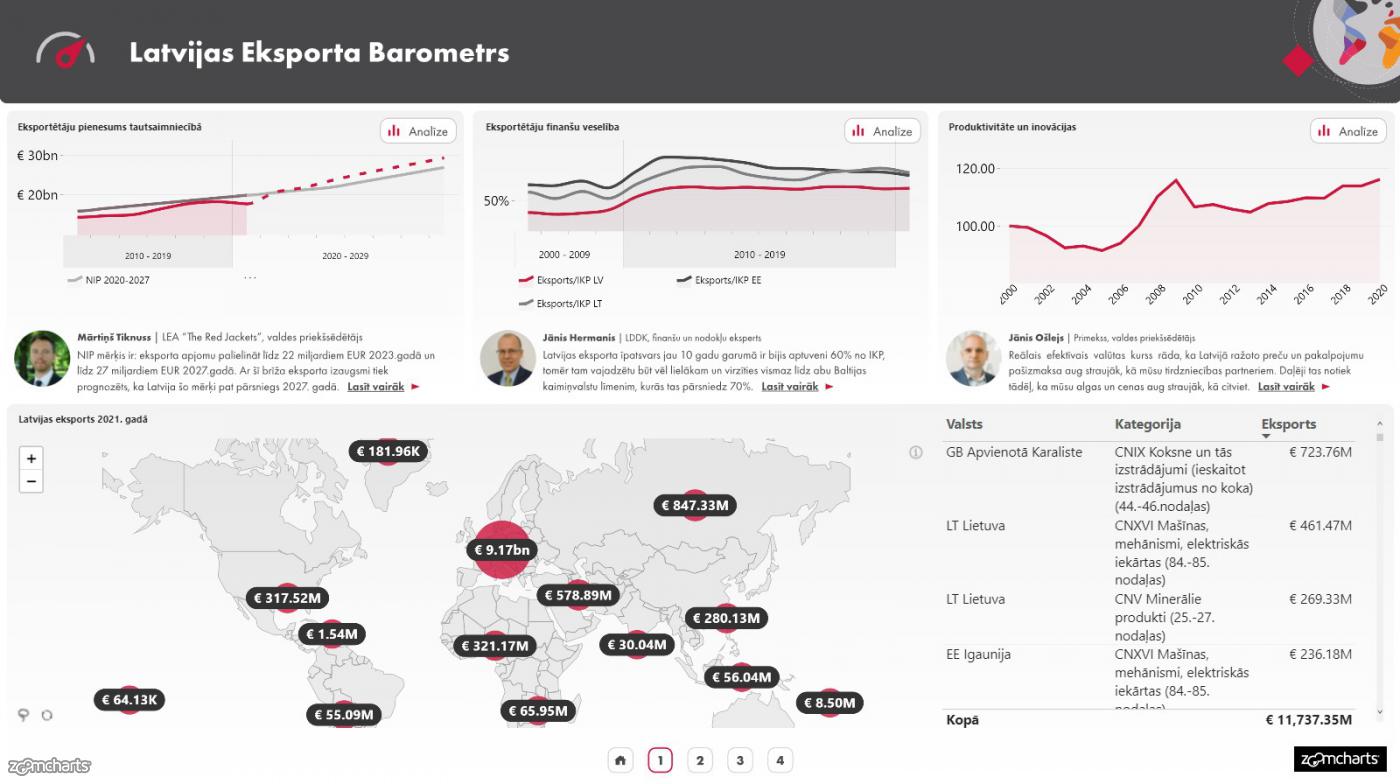
ZoomCharts took part in a widescale project that created a full report of Latvia’s Export Barometer. This report focused on Latvia’s export shifts within the past 3 years to more accurately assess Latvia’s overall export growth.

The Latvia Export Barometer is intended to showcase Latvia’s export landscape to a wider audience, including the government sector, companies, and the general public. The interactive nature of the report, made possible by ZoomCharts, allows everyone to gain full comprehension of Latvia’s exportation process. The Latvia Export Barometer was publicly demonstrated during the Export and Innovation Awards’ closing ceremony and is available for public viewing online.

The Journey From Raw data to beautiful report

ZoomCharts received datasets from a variety of data and statistics suppliers and set out to clean up the data in preparation for importing it into Power BI. After discussing what story should the report tell and ensuring that it was not oversaturated with information while still being capable of engaging users, we input that data into Power BI. 

A report cannot be made more interactive than the data permits. If the data is one-dimensional and straightforward, there is no use in performing a drill-down to analyze the data deeper or look at it from different aspects. 

ZoomCharts custom visuals are known for their interactive approach to data visualization and analysis. We strive to provide stellar interactive charts through our custom visuals and report design services. 

If you would like to have your business data turned into highly engaging and productive reports, ZoomCharts offers a report overhaul service, where we can help take the next step into the world of BI.
Get better reports

See full report here! 


envelope icon

Want more info like this?

Subscribe to our newsletter and be the first to read our latest articles and expert data visualization tips!


Find out more

Aug 30, 2021

Blog Thumbnail
Guides

Business Intelligence Implementation: A Complete Guide

It's no secret that the leading organizations of the world don't take any chances when it comes to business strategy - they use business intelligence to make data-driven decisions. Just like a sports team needs a coach or an army needs a strategist to achieve victory, your can reach your business goals more efficiently with the help of a robust BI system and expert BI analysts.

Sep 02, 2022

Blog Thumbnail
Pro reports

Power BI Design Tips: Make Your Reports More Efficient

What are some of the best design practices and most important tips for designing a great Power BI dashboard? How can you design a report that is both appealing and efficient at conveying business information? Learn more in this article!

Sep 07, 2022

Blog Thumbnail
Pro reports

Top 5 Best Power BI Report Design Practices

First impressions matter, even when you're creating Power BI reports. When your users open your report for the first time, they need to be presented with good-looking visuals that present data in an easy-to-read way, otherwise they'll leave confused and with more questions than before.

Aug 31, 2022

Blog Thumbnail
Guides

Tips and Tricks for Power BI Map visualizations

Maps are one of the most important data visualizations for businesses these days. With the rise of globalization, companies are looking to expand and transcend borders. This makes it necessary to track and analyze data on a geographic level, presenting a new element of map visualization when making data-driven decisions.

Sep 22, 2020

Blog Thumbnail
Use cases

Use case for a graph visual: mapping subsidiaries of an international organization

ZoomCharts Drill Down Graph PRO offers multiple layout options and unseen level of interaction. In this article we will explore a use case of mapping parent...

Sep 22, 2020

Blog Thumbnail
Use cases

Power BI Email Analysis: How To Visualize Internal Communication

You and your colleagues, most likely, send thousands of emails between each other. You can transform these emails into valuable data by performing a Power BI email analysis. It's a great way to optimize your internal communication channels and identify possible issues, and in this article, we will show you how to do it by using Drill Down Graph PRO.
  • «
  • 1
  • ...
  • 6
  • 7
  • 8
  • 9
  • 10
  • 11
  • »

Contents

Share this article

Want more info like this?

Subscribe to our newsletter and be the first to read our latest articles and expert data visualization tips!

Thank you!

Check your inbox to verify your email address.

logo
[email protected]
+44 204 577 3993
logo

Products

Drill Down Network PRO Drill Down Waterfall PRO Drill Down Graph PRO Drill Down Combo PRO Drill Down Combo Bar PRO Drill Down Donut PRO Drill Down Pie PRO Drill Down TimeSeries PRO Drill Down Timeline PRO Drill Down Map PRO Drill Down Scatter PRO All Visuals

Resources

Report Examples Webinars Blog ZoomCharts Academy Visuals Gallery Documentation Custom Visual Development Subscribe to News

Solutions

Custom Visual Development

Company

Pricing About Us Partners Leave feedback Join PowerGroup EU Funding

Help

ZoomCharts Assistance Contact Sales Contact Support FAQ

Drill Down Network PRO Drill Down Waterfall PRO Drill Down Graph PRO Drill Down Combo PRO Drill Down Combo Bar PRO Drill Down Donut PRO Drill Down Pie PRO Drill Down TimeSeries PRO Drill Down Timeline PRO Drill Down Map PRO Drill Down Scatter PRO All Visuals

Report Examples Webinars Blog ZoomCharts Academy Visuals Gallery Documentation Custom Visual Development Subscribe to News

Custom Visual Development

Pricing About Us Partners Leave feedback Join PowerGroup EU Funding

ZoomCharts Assistance Contact Sales Contact Support FAQ
+44 204 577 3993
[email protected]

Ready to get in touch?

Contact our experts with any question about Power BI and ZoomCharts for Free!

Contact us

© 2025, Data Visualization Software Lab

U.S. Patents No. 11,645,343; 11,921,804

Cookies Policy
Manage cookies
Privacy Policy
Global
EULA
Patent
warning

Error message

success

Success info: Done!

ZoomCharts AI Assistant

We noticed you're using an old OS version.

For the best experience, we recommend upgrading to ensure that all website features display correctly.

Cookie settings

We use necessary cookies for site functionality, as well as statistic, marketing, and preference cookies to enhance your experience. For more information and to manage your preferences, please visit our Cookie policy