WEBINAR
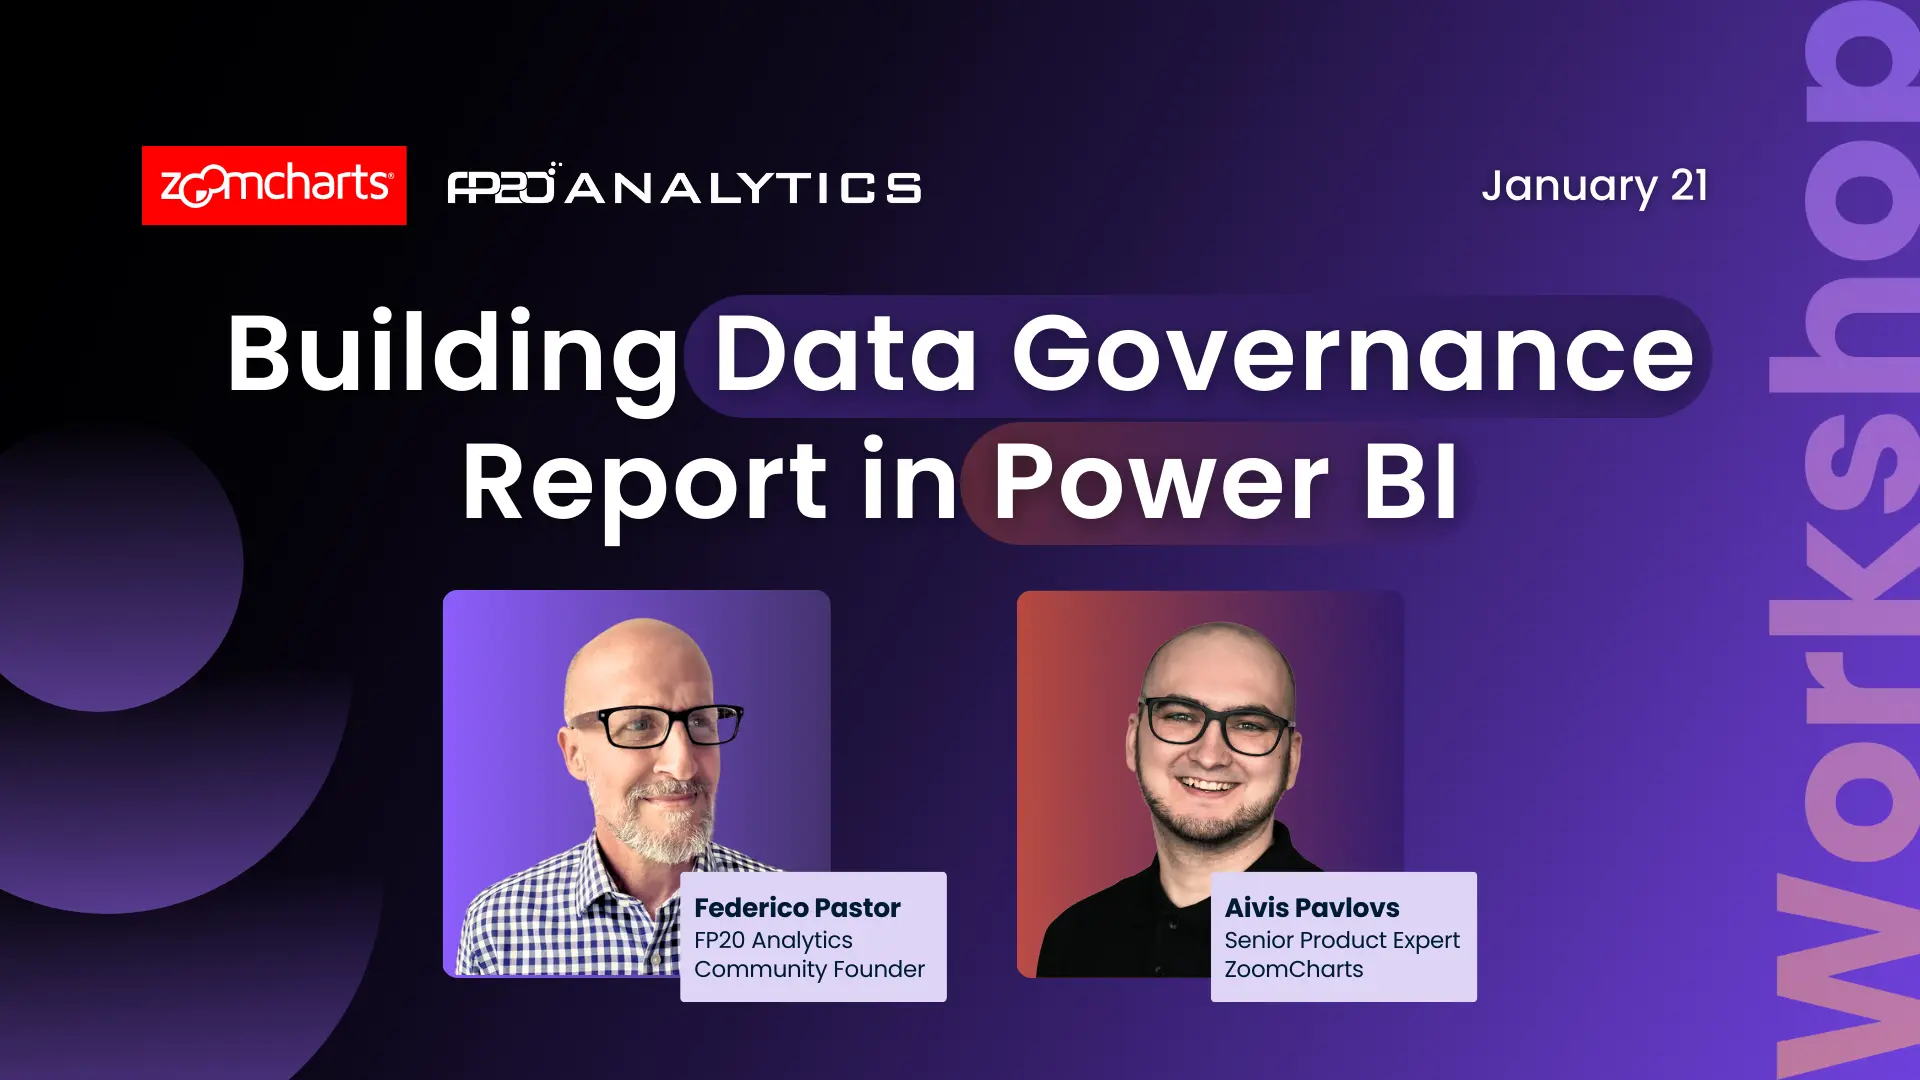
Building Impactful Data Governance Reports in Power BI - LIVE Workshop
Join this hands-on Power BI workshop to explore a real-world data governance dataset, learn best practices in modeling and storytelling, and build interactive reports using ZoomCharts and Power BI native visuals!
WATCH RECORDING
About webinar
In this live workshop, ZoomCharts teams up with FP20 Analytics to guide you through building a Power BI report focused on enterprise data governance, data quality, and compliance.
Using the FP20 Analytics Challenge dataset, you’ll work with realistic governance data covering data ownership, quality metrics, audits, compliance risks, and financial exposure across business domains. The session focuses on practical techniques you can immediately apply to your challenge submission and real-world reporting scenarios.
During the workshop, you’ll learn how to:
-
Model complex governance and compliance data in Power BI
-
Create meaningful KPIs for data quality, audit results, and risk exposure
-
Design interactive dashboards using ZoomCharts Drill Down PRO visuals
-
Apply storytelling techniques to clearly communicate governance insights to decision-makers
The workshop is led by Federico Pastor and Aivis Pavlovs, and is designed to support and inspire FP20 Analytics Challenge participants.
Who should attend:
Power BI developers, data analysts, BI managers, and executive managers who want to explore better ways to analyze data governance and communicate insights effectively.
📅 Date: 21st January
📍 Streaming live on: LinkedIn, YouTube, and Facebook
Date and time
21 Jan, 2026
08:00 AM - EST
Speakers

Aivis Pavlovs, Senior Product Expert at ZoomCharts

Federico Pastor, Power BI Trainer and FP20 Analytics Community Founder
Watch recording
About webinar
In this live workshop, ZoomCharts teams up with FP20 Analytics to guide you through building a Power BI report focused on enterprise data governance, data quality, and compliance.
Using the FP20 Analytics Challenge dataset, you’ll work with realistic governance data covering data ownership, quality metrics, audits, compliance risks, and financial exposure across business domains. The session focuses on practical techniques you can immediately apply to your challenge submission and real-world reporting scenarios.
During the workshop, you’ll learn how to:
-
Model complex governance and compliance data in Power BI
-
Create meaningful KPIs for data quality, audit results, and risk exposure
-
Design interactive dashboards using ZoomCharts Drill Down PRO visuals
-
Apply storytelling techniques to clearly communicate governance insights to decision-makers
The workshop is led by Federico Pastor and Aivis Pavlovs, and is designed to support and inspire FP20 Analytics Challenge participants.
Who should attend:
Power BI developers, data analysts, BI managers, and executive managers who want to explore better ways to analyze data governance and communicate insights effectively.
📅 Date: 21st January
📍 Streaming live on: LinkedIn, YouTube, and Facebook
Date and time
21 Jan, 2026
08:00 AM - EST
Speakers
Aivis Pavlovs, Senior Product Expert at ZoomCharts
Federico Pastor, Power BI Trainer and FP20 Analytics Community Founder