709
Washington DC Crimes Report
Washington DC Crimes Report
Report Author: Sukesh Kumar
709
Share template with others
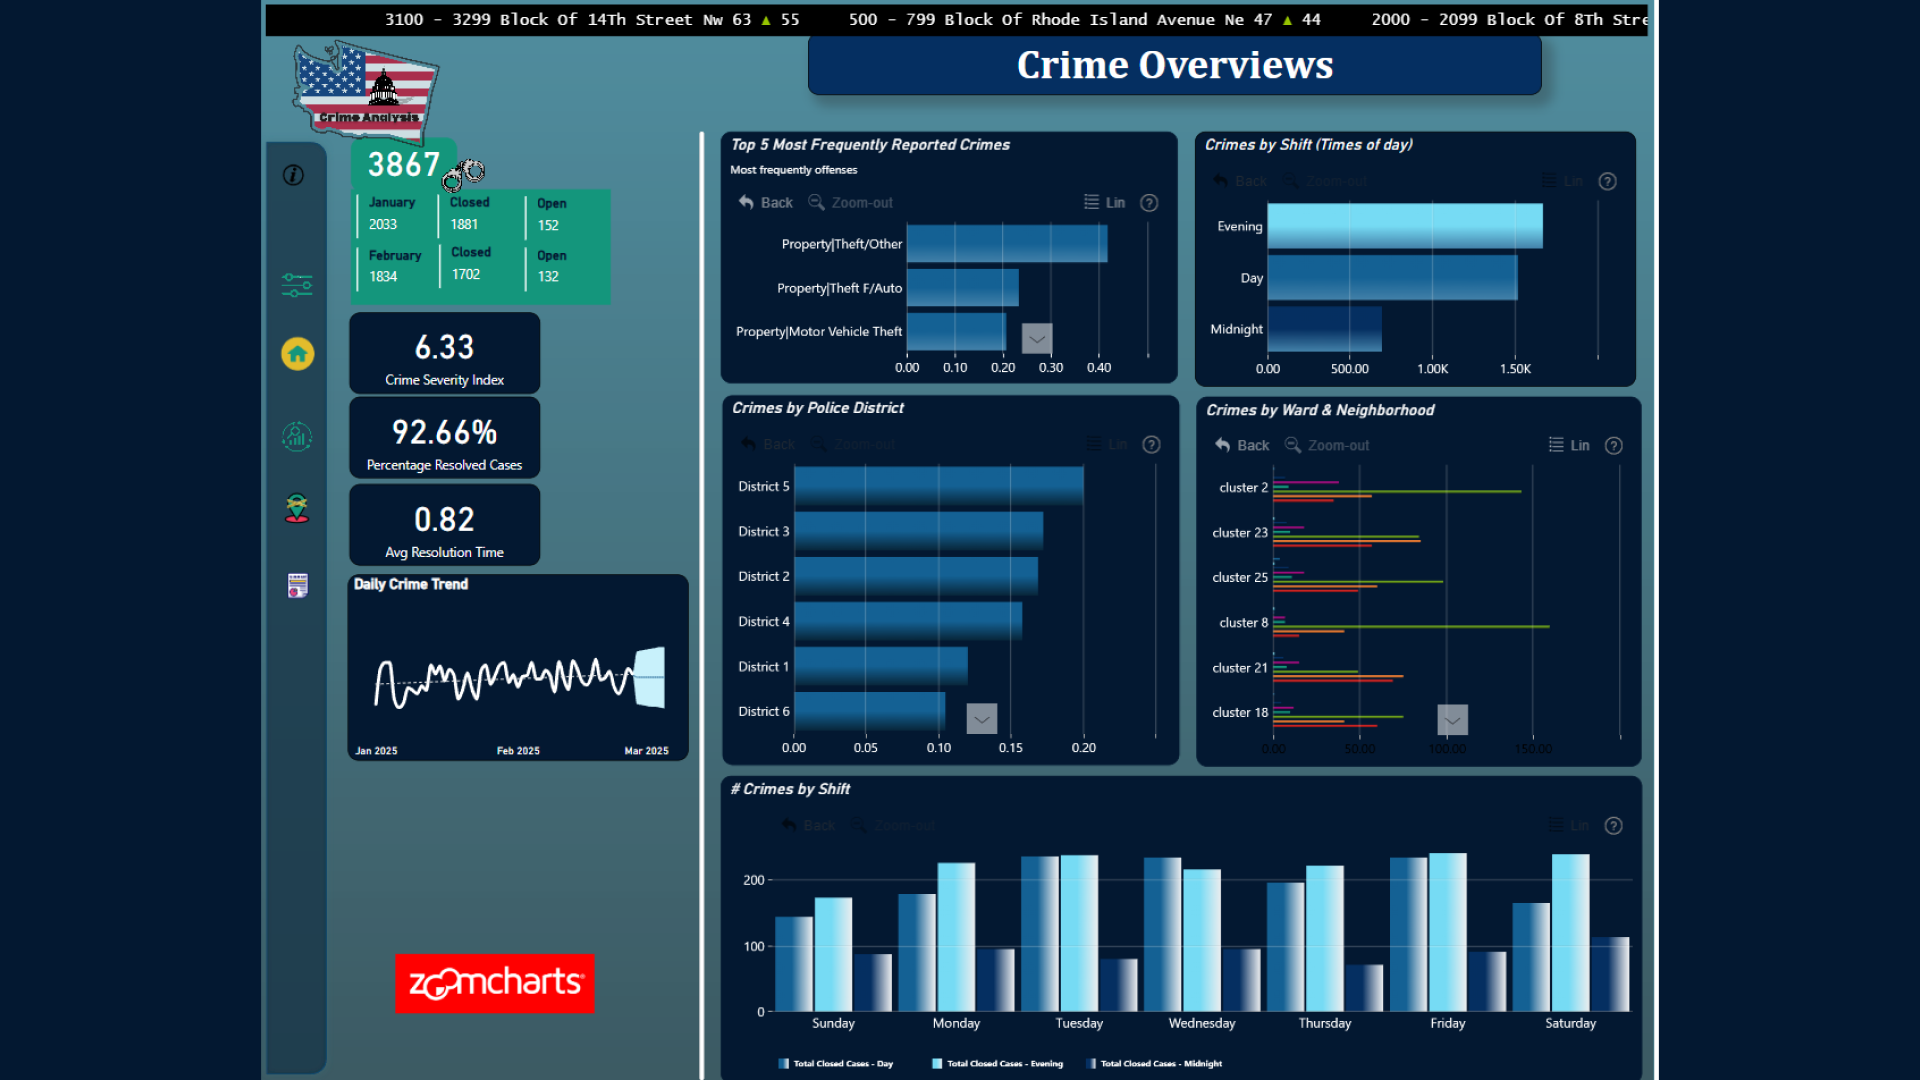
Report submitted for Onyx Data DataDNA ZoomCharts Mini Challenge, March 2025. The report is based on the Crime Analysis Dataset and includes ZoomCharts custom Drill Down PRO visuals for Power BI.
Author's Description
Explore cutting-edge crime trend analysis in Washington, D.C. using Power BI. This project dives into crime rates across shifts, highlights high-risk neighbourhoods, and reviews resolution successes, providing critical insights for enhanced community safety and strategic law enforcement planning.
4U Report Challenges
Participate in data challenges, build and submit reports to get free template downloads.
Join CommunityMobile view allows you to interact with the report. To Download the template please switch to desktop view.

Was this helpful? Thank you for your feedback!
Sorry about that.
How can we improve it?