746
Washington Crimes Data Analysis
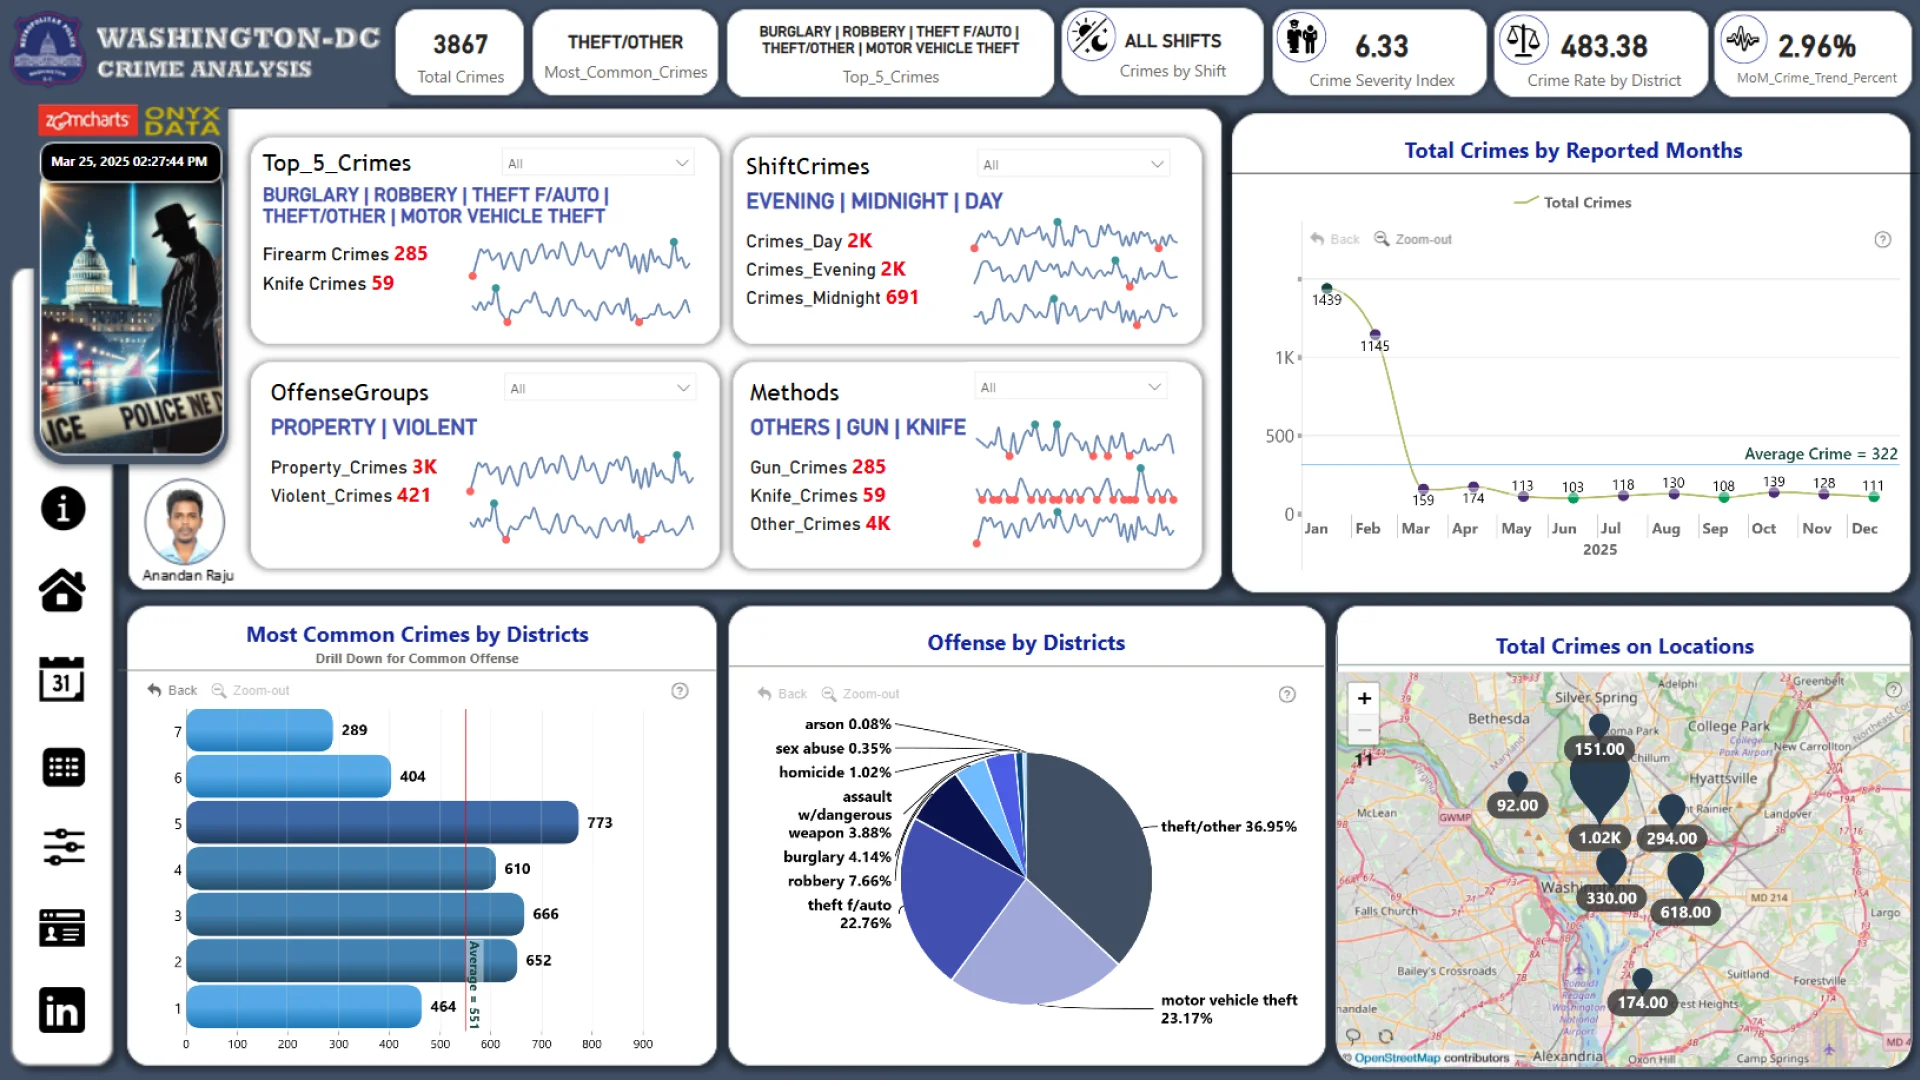
Washington Crimes Data Analysis
Report Author: Anandan Raju
746
Share template with others
Report submitted for Onyx Data DataDNA ZoomCharts Mini Challenge, March 2025. The report is based on the Crime Analysis Dataset and includes ZoomCharts custom Drill Down PRO visuals for Power BI.
Authors Description
Using Power BI, I built an interactive dashboard with advanced filtering, dynamic navigation, and innovative visuals to make the insights more useful and visually stunning. This project showcases how data visualization transforms raw data into meaningful insights. A big thank you to Onyx Data and ZoomCharts for this amazing opportunity!
ZoomCharts visuals used
4U Report Challenges
Participate in data challenges, build and submit reports to get free template downloads.
Join CommunityMobile view allows you to interact with the report. To Download the template please switch to desktop view.


Was this helpful? Thank you for your feedback!
Sorry about that.
How can we improve it?