22699
Used Car Sales Analytics Power BI Report by Prathamesh Sawant
Used Car Sales Analytics Power BI Report by Prathamesh Sawant

More Report pages
Report Author: Prathamesh Sawant
22699
Share template with others
Summary
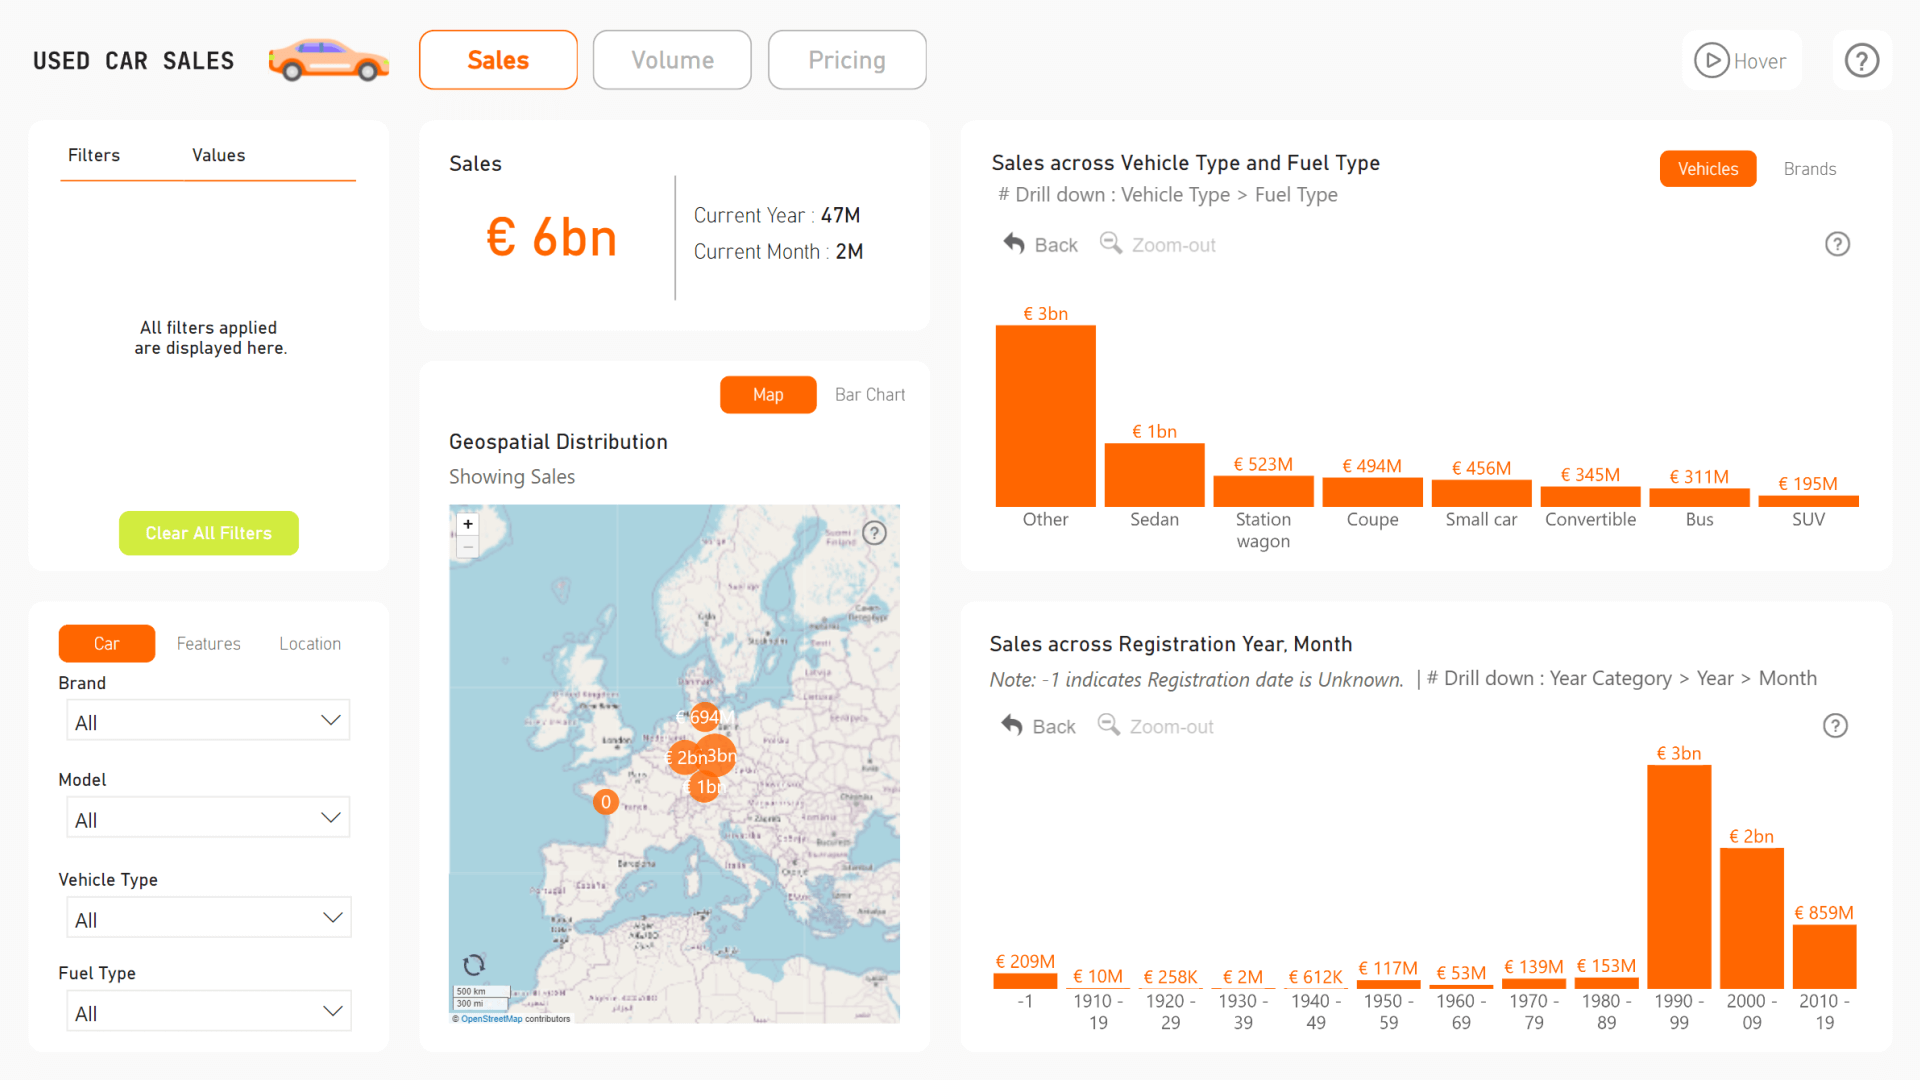
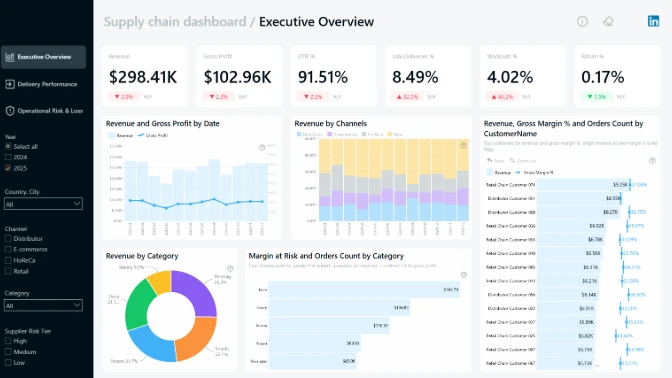
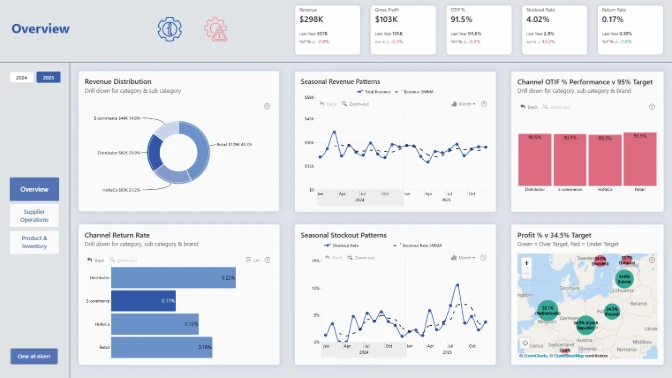
This Power BI report is based on the winning entry for ZoomCharts Mini Challenge which was hosted as a part of the Onyx Data March 2024 Challenge. The report was created using a dataset of eBay used car sales with the aim to analyze market trends.
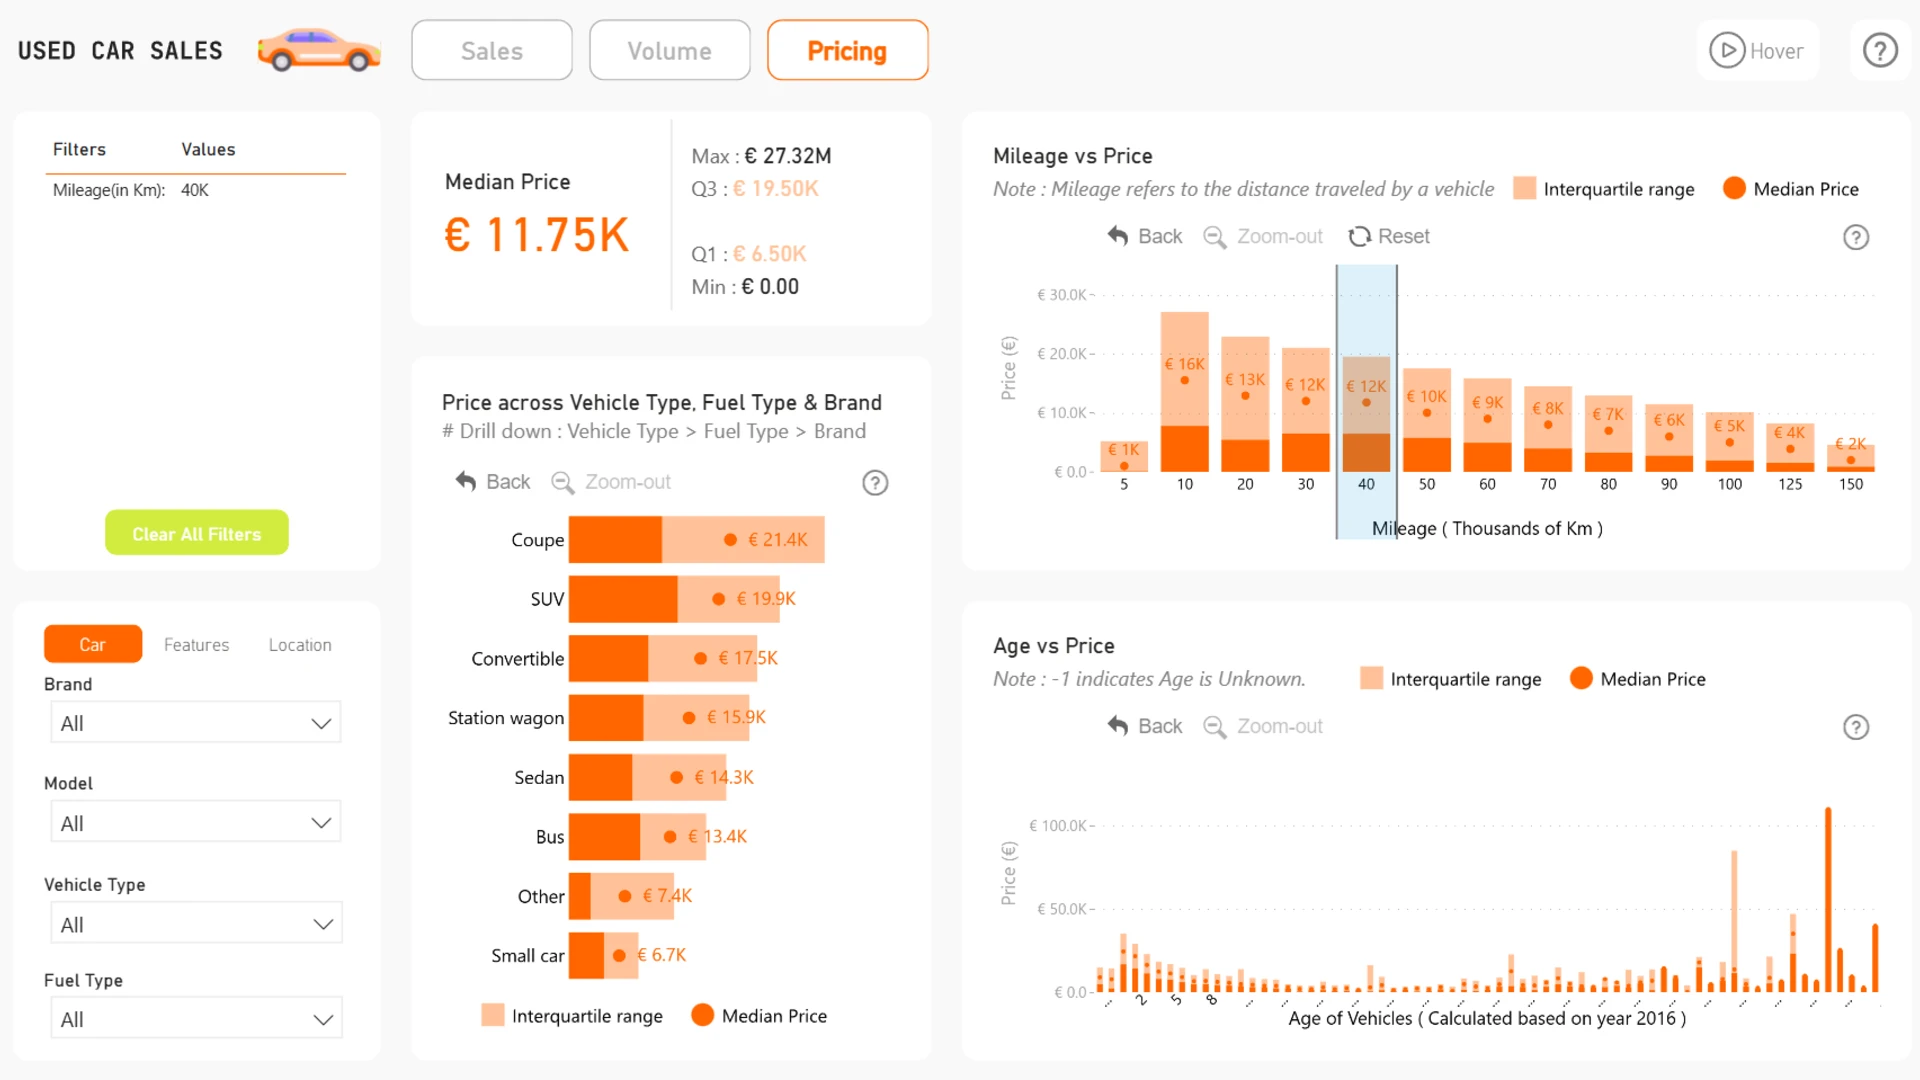
The report uses multiple interactive visuals to provide various insights about used car sales, including revenue or sales volume per car vehicle type, region, age, and other factors. Furthermore, the report can explore trends in average car prices.
The report is based on the challenge submission with minor refinements by the ZoomCharts team. See the original submission here.
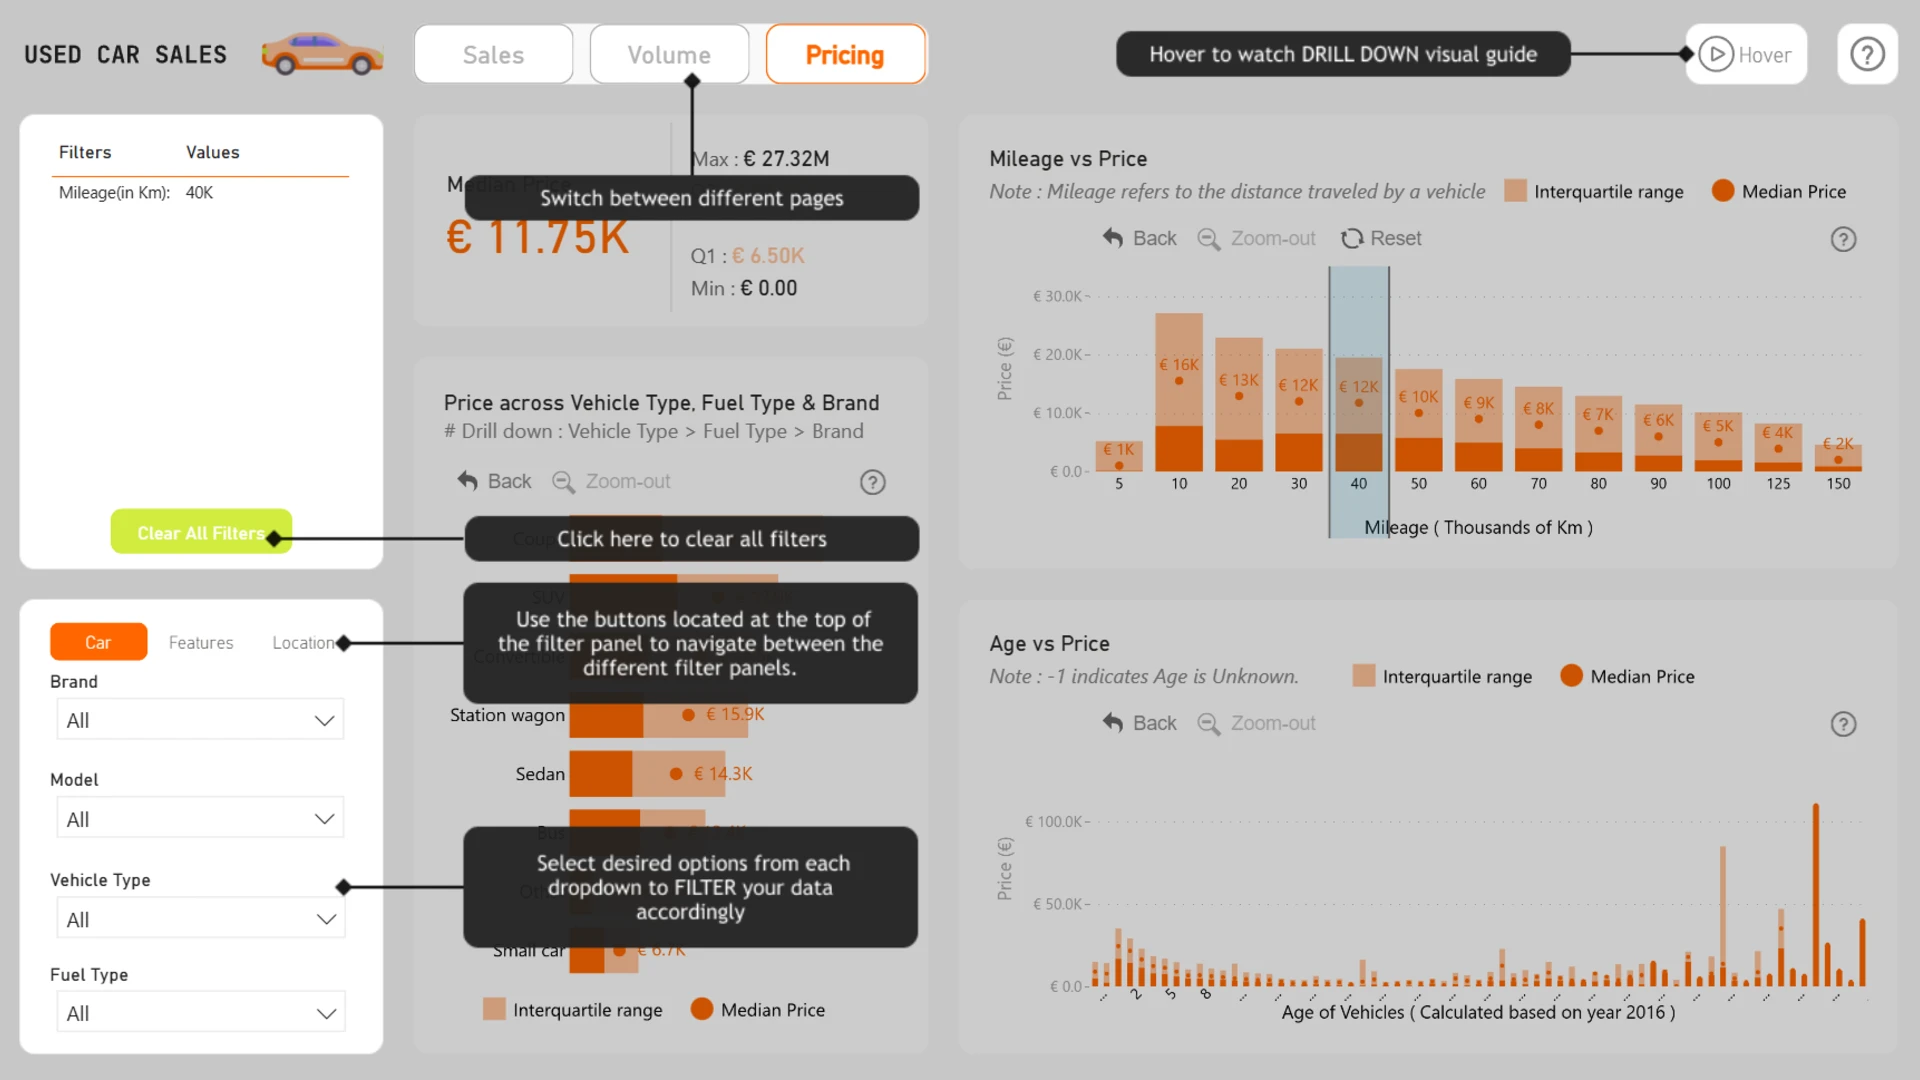
How To Use This Report Template
To interact with this Power BI report, simply click any active elements directly on the charts.
Download this report to see all the settings, formulas, and calculations. Try it out with your own data by making a few adjustments.
4U Report Challenges
Participate in data challenges, build and submit reports to get free template downloads.
Join CommunityMobile view allows you to interact with the report. To Download the template please switch to desktop view.
Was this helpful? Thank you for your feedback!
Sorry about that.
How can we improve it?