875
Transportation & Logistics Data Analysis
Transportation & Logistics Data Analysis
Report Author: Raina Oommen
875
Share template with others
Report submitted for the FP20 Analytics ZoomCharts Challenge, February-March 2025. The report was built using the Transportation & Logistics Dataset and includes ZoomCharts custom Drill Down PRO visuals for Power BI.
Author's Description:
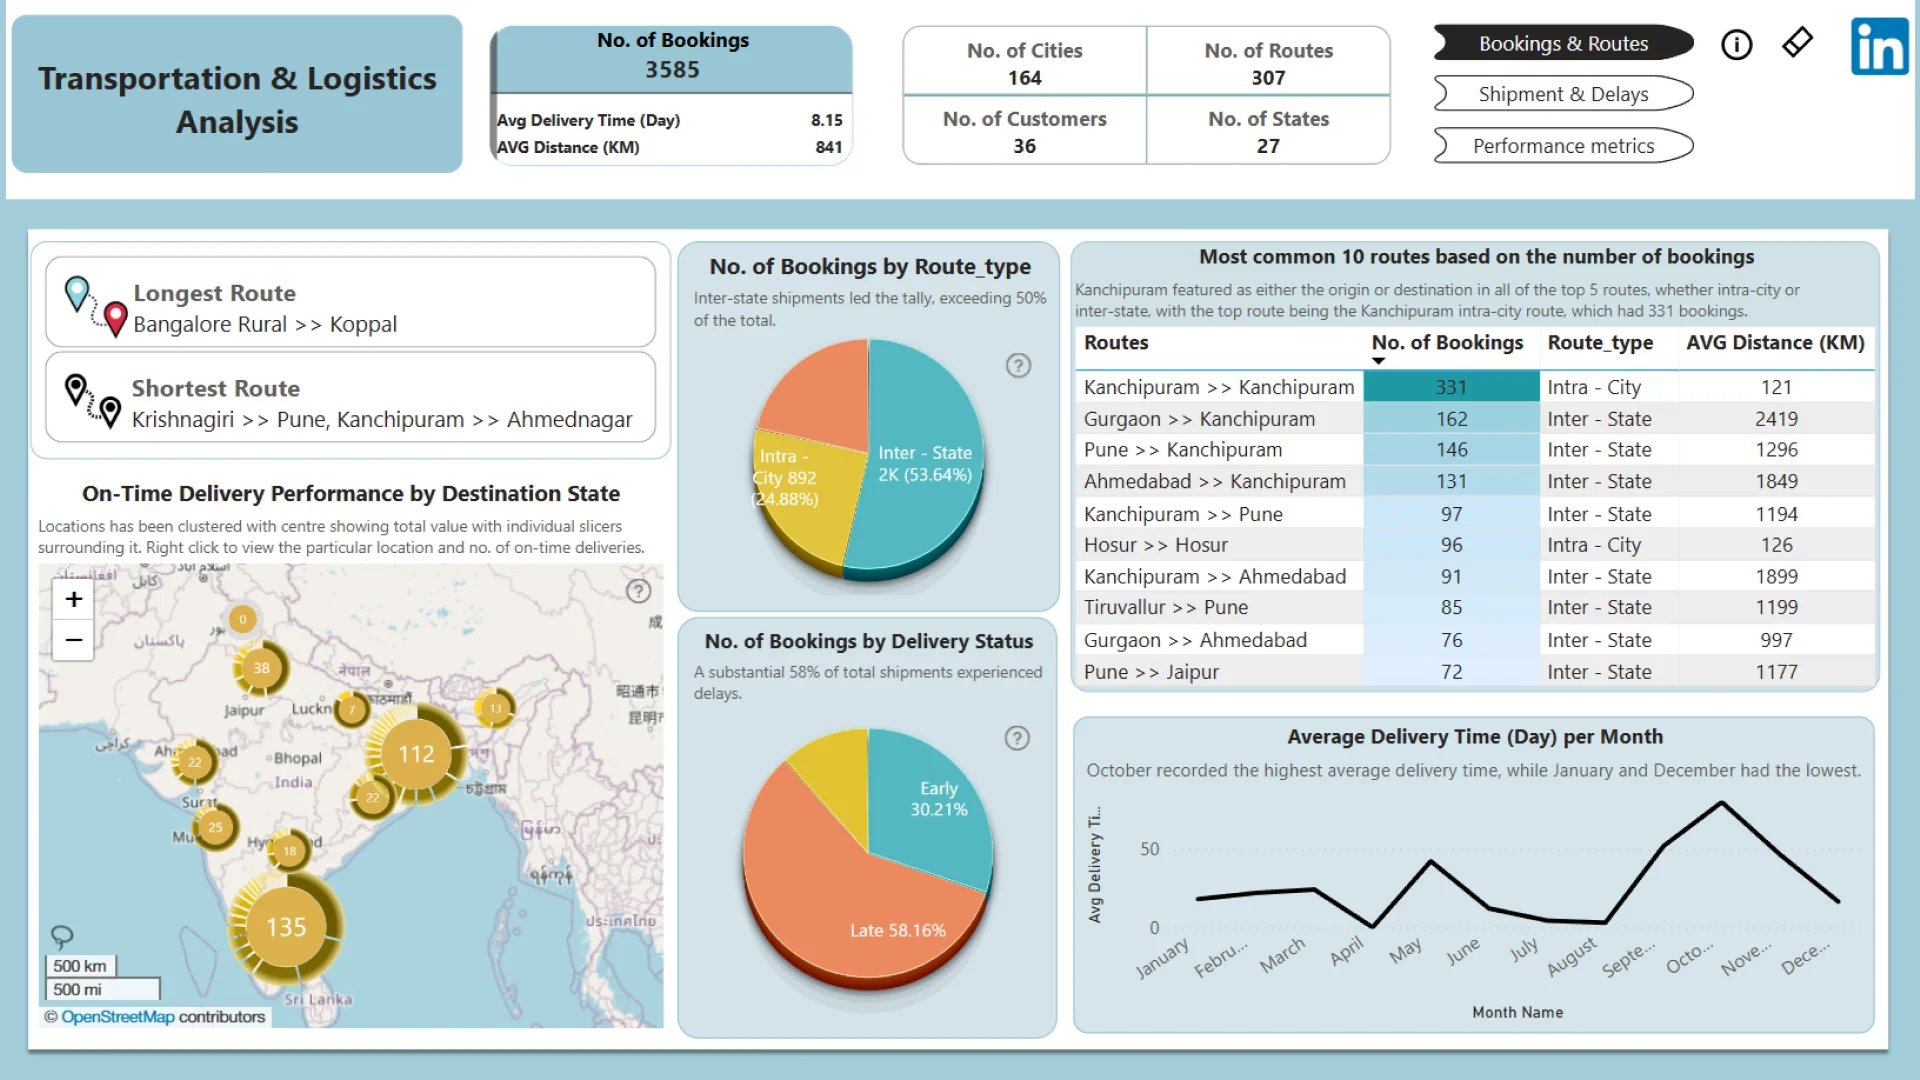
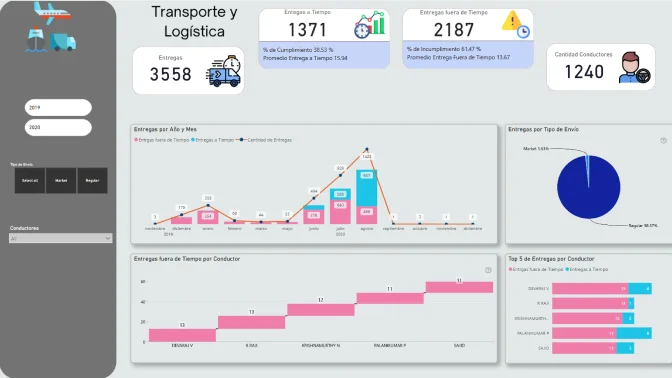
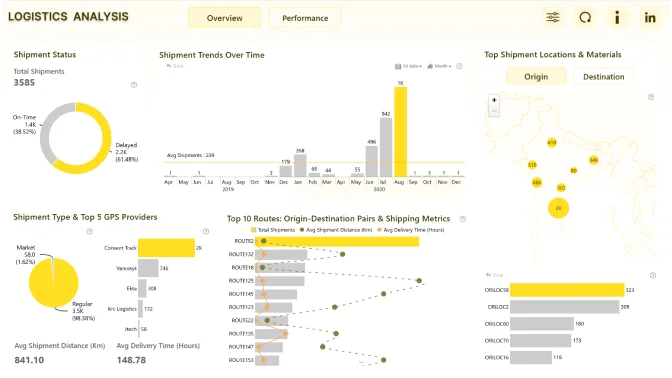
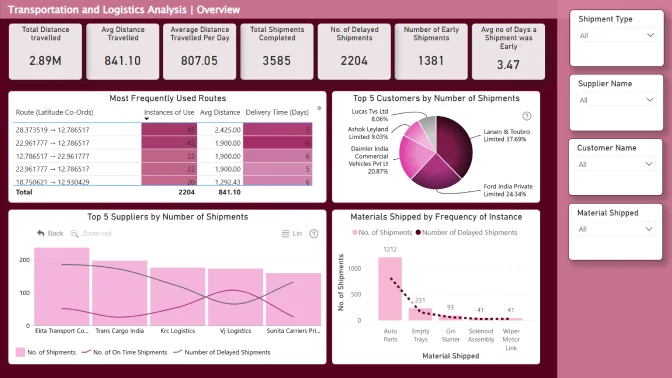
📊The analysis report examines common shipment delays, their causes, and how they impact overall logistics performance. By leveraging Power BI and DAX, the report provides insights into route efficiency, transit times, and delay patterns, helping to improve decision-making for logistics management.
4U Report Challenges
Participate in data challenges, build and submit reports to get free template downloads.
Join CommunityMobile view allows you to interact with the report. To Download the template please switch to desktop view.
Was this helpful? Thank you for your feedback!
Sorry about that.
How can we improve it?