692
Technical support
Technical support
More Report pages
Report Author: David Amri
692
Share template with others
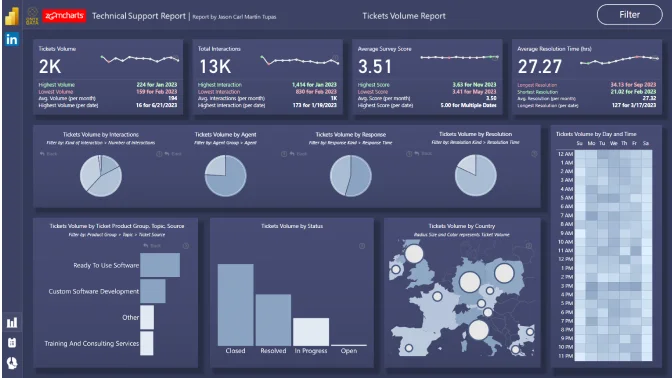
Report submitted for Onyx Data DataDNA ZoomCharts Mini Challenge, May 2024. The report was built based on Tech Support Analysis dataset and includes ZoomCharts custom Drill Down PRO visuals for Power BI.
Author's description:
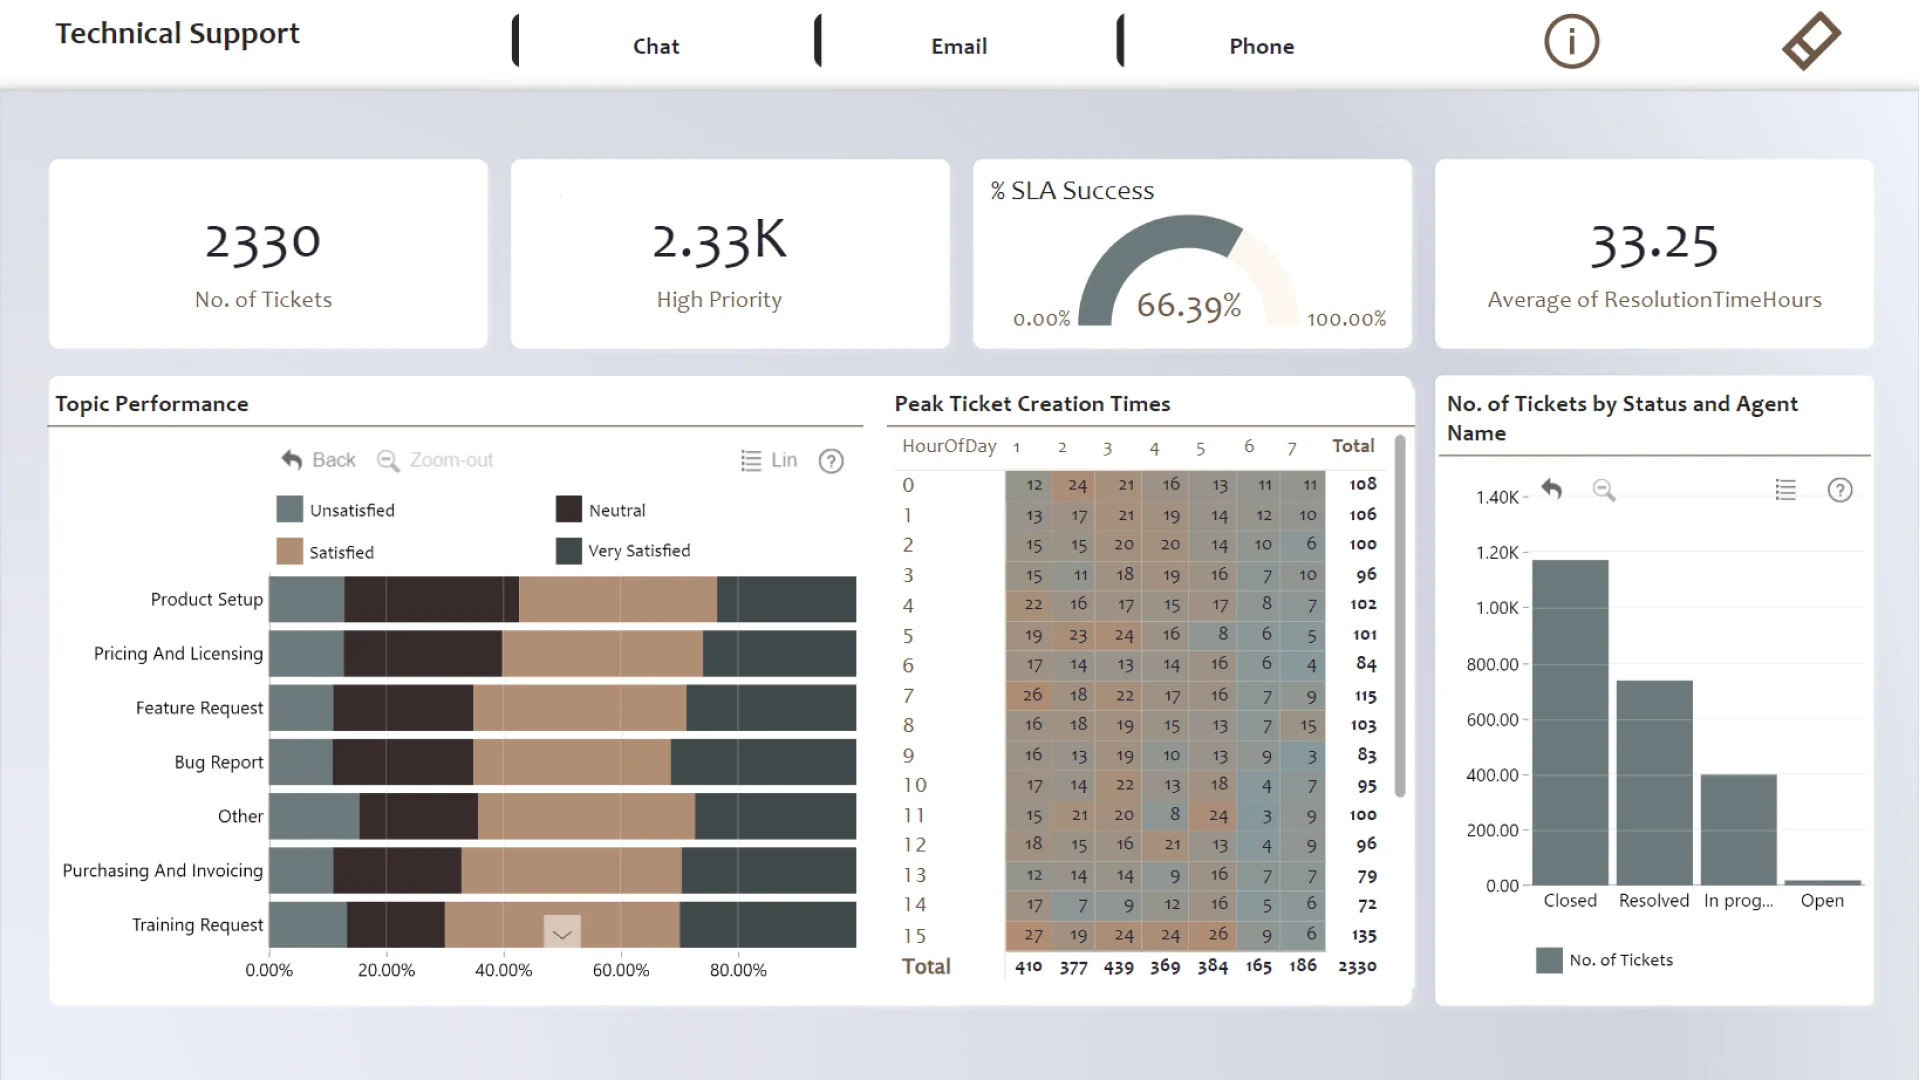
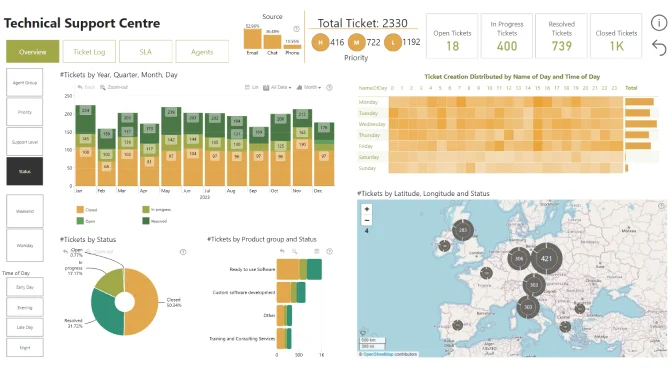
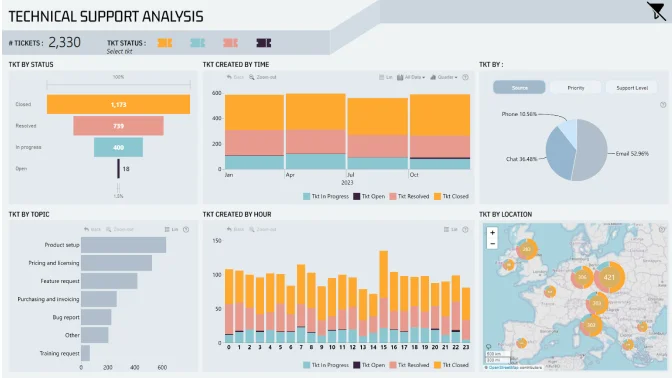
The main objective is to provide insights into the KPIs cantered around Technical Support. The report analyses SLA success, Average resolution times, Customer Topic performance, Peak Tick Creation Breakdown times and ticket status, thus providing a holistic view of Agent performance.
4U Report Challenges
Participate in data challenges, build and submit reports to get free template downloads.
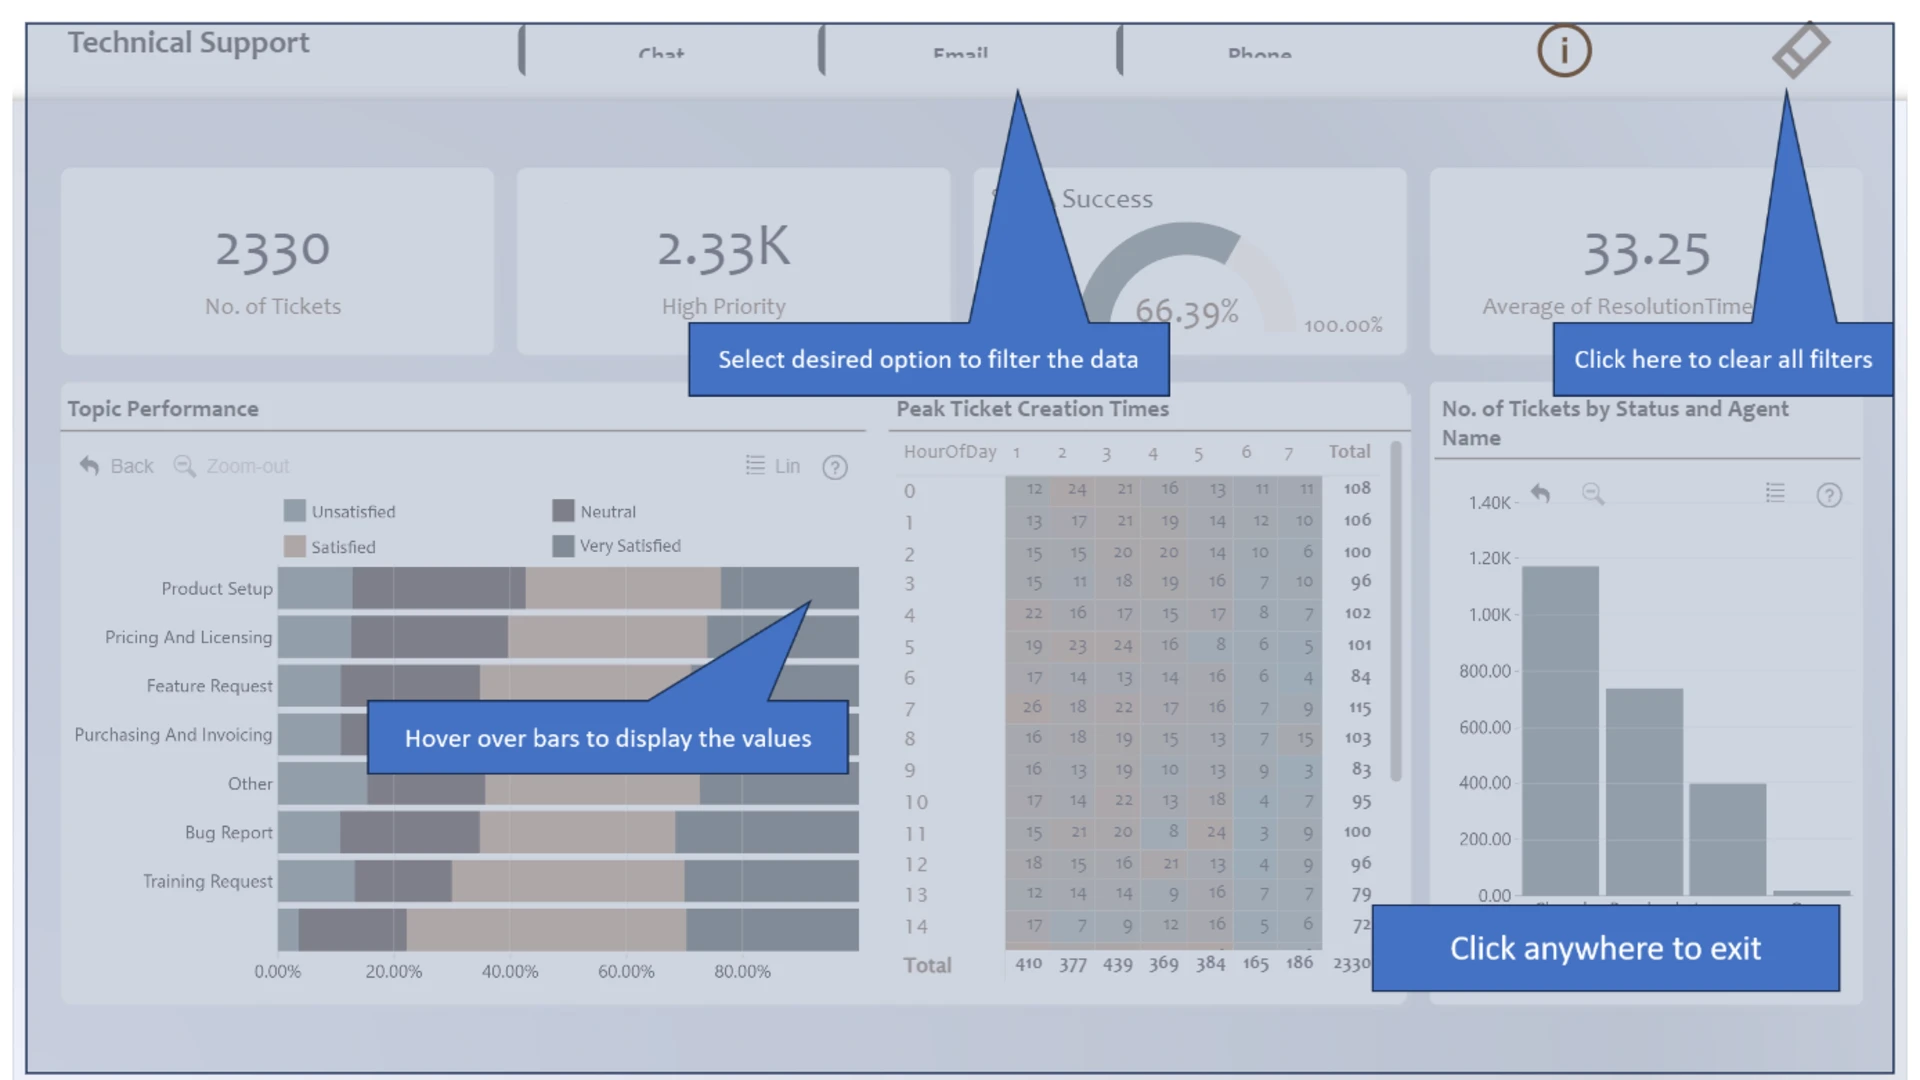
Join CommunityMobile view allows you to interact with the report. To Download the template please switch to desktop view.
Was this helpful? Thank you for your feedback!
Sorry about that.
How can we improve it?