1198
Tactical Crime Analysis 23
Tactical Crime Analysis 23
More Report pages
Report Author: Prakash Singh
1198
Share template with others
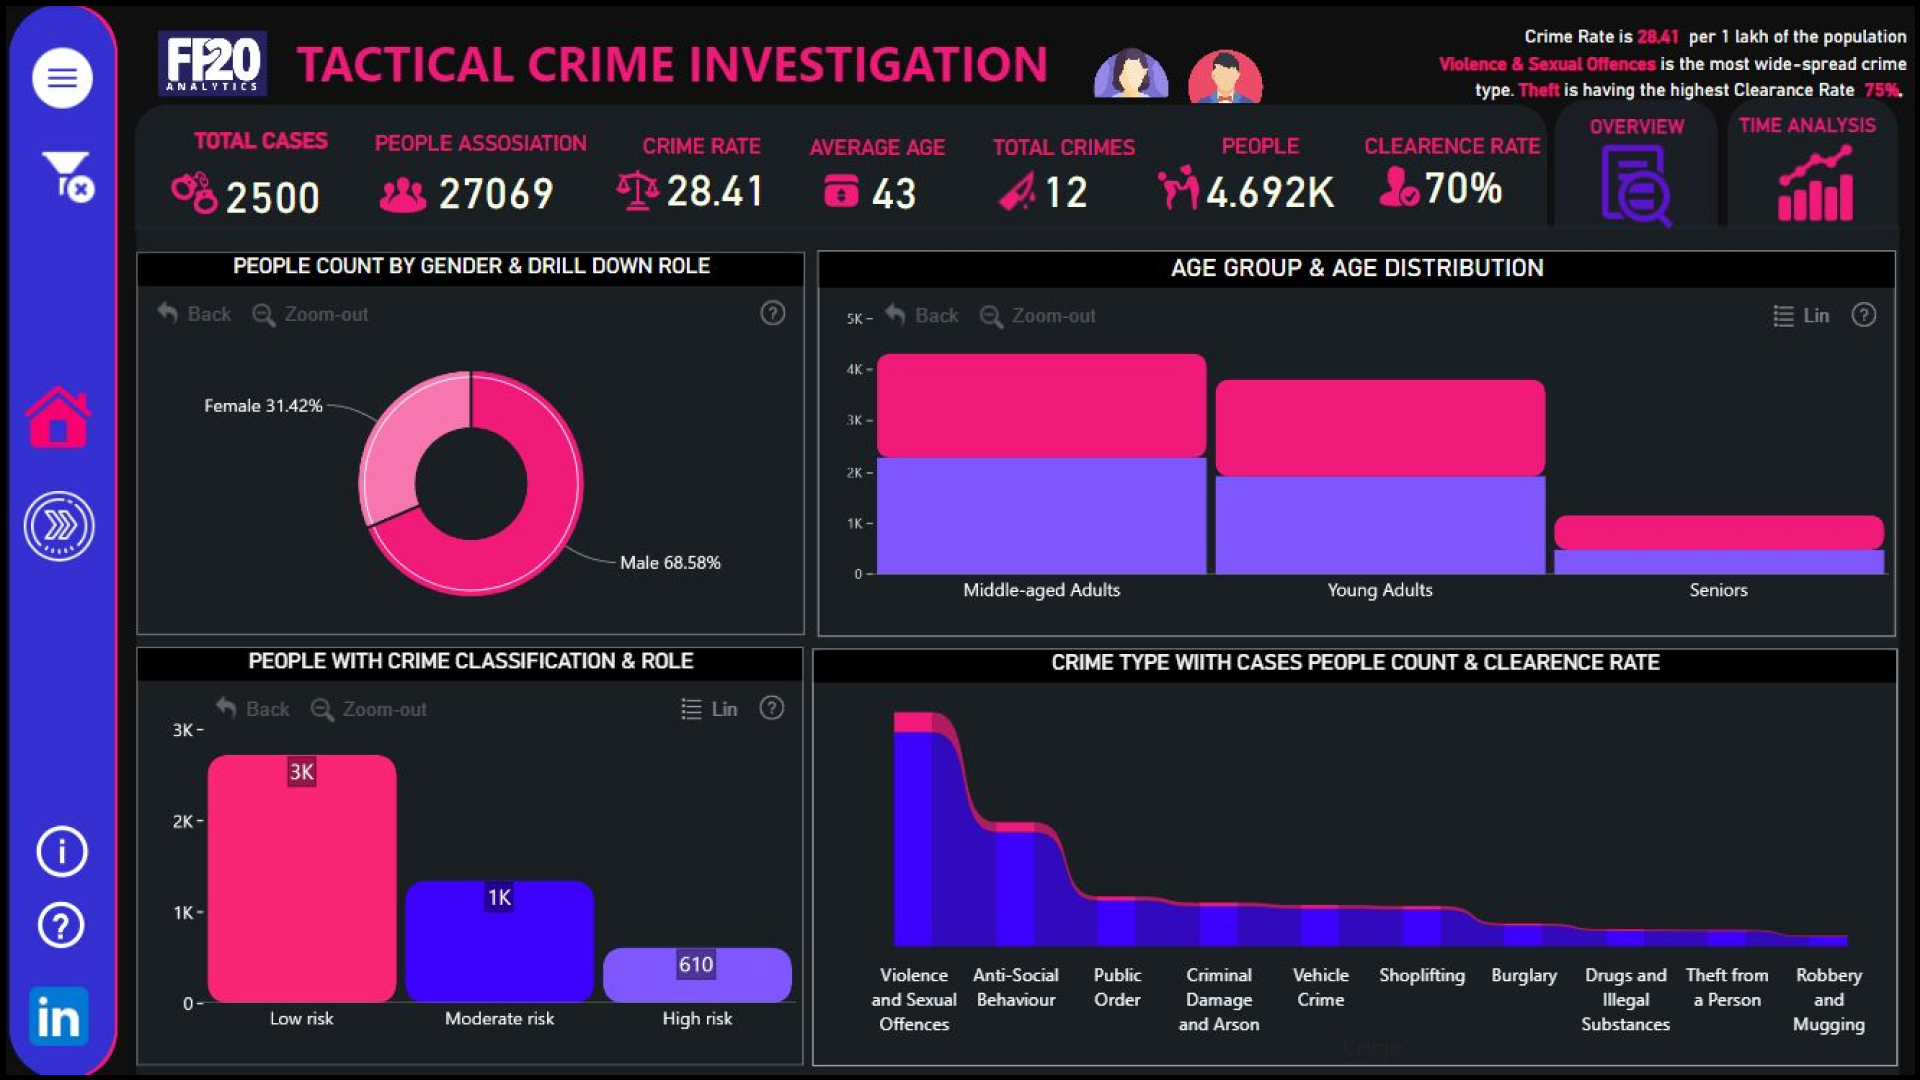
Report submitted for FP20 Analytics ZoomCharts Challenge, November 2023. The report was built with Tactical Crime Analysis dataset and includes ZoomCharts custom Drill Down PRO visuals for Power BI.
Author's description:
🚨 Crime Insights:
📊 Our analysis reveals a crime rate of 28.41 per 1 lakh population, emphasizing the prevalence of Violence & Sexual Offences. Noteworthy is the 75% Clearance Rate for Theft and a significant 69% of crimes occurring during the evening and night.
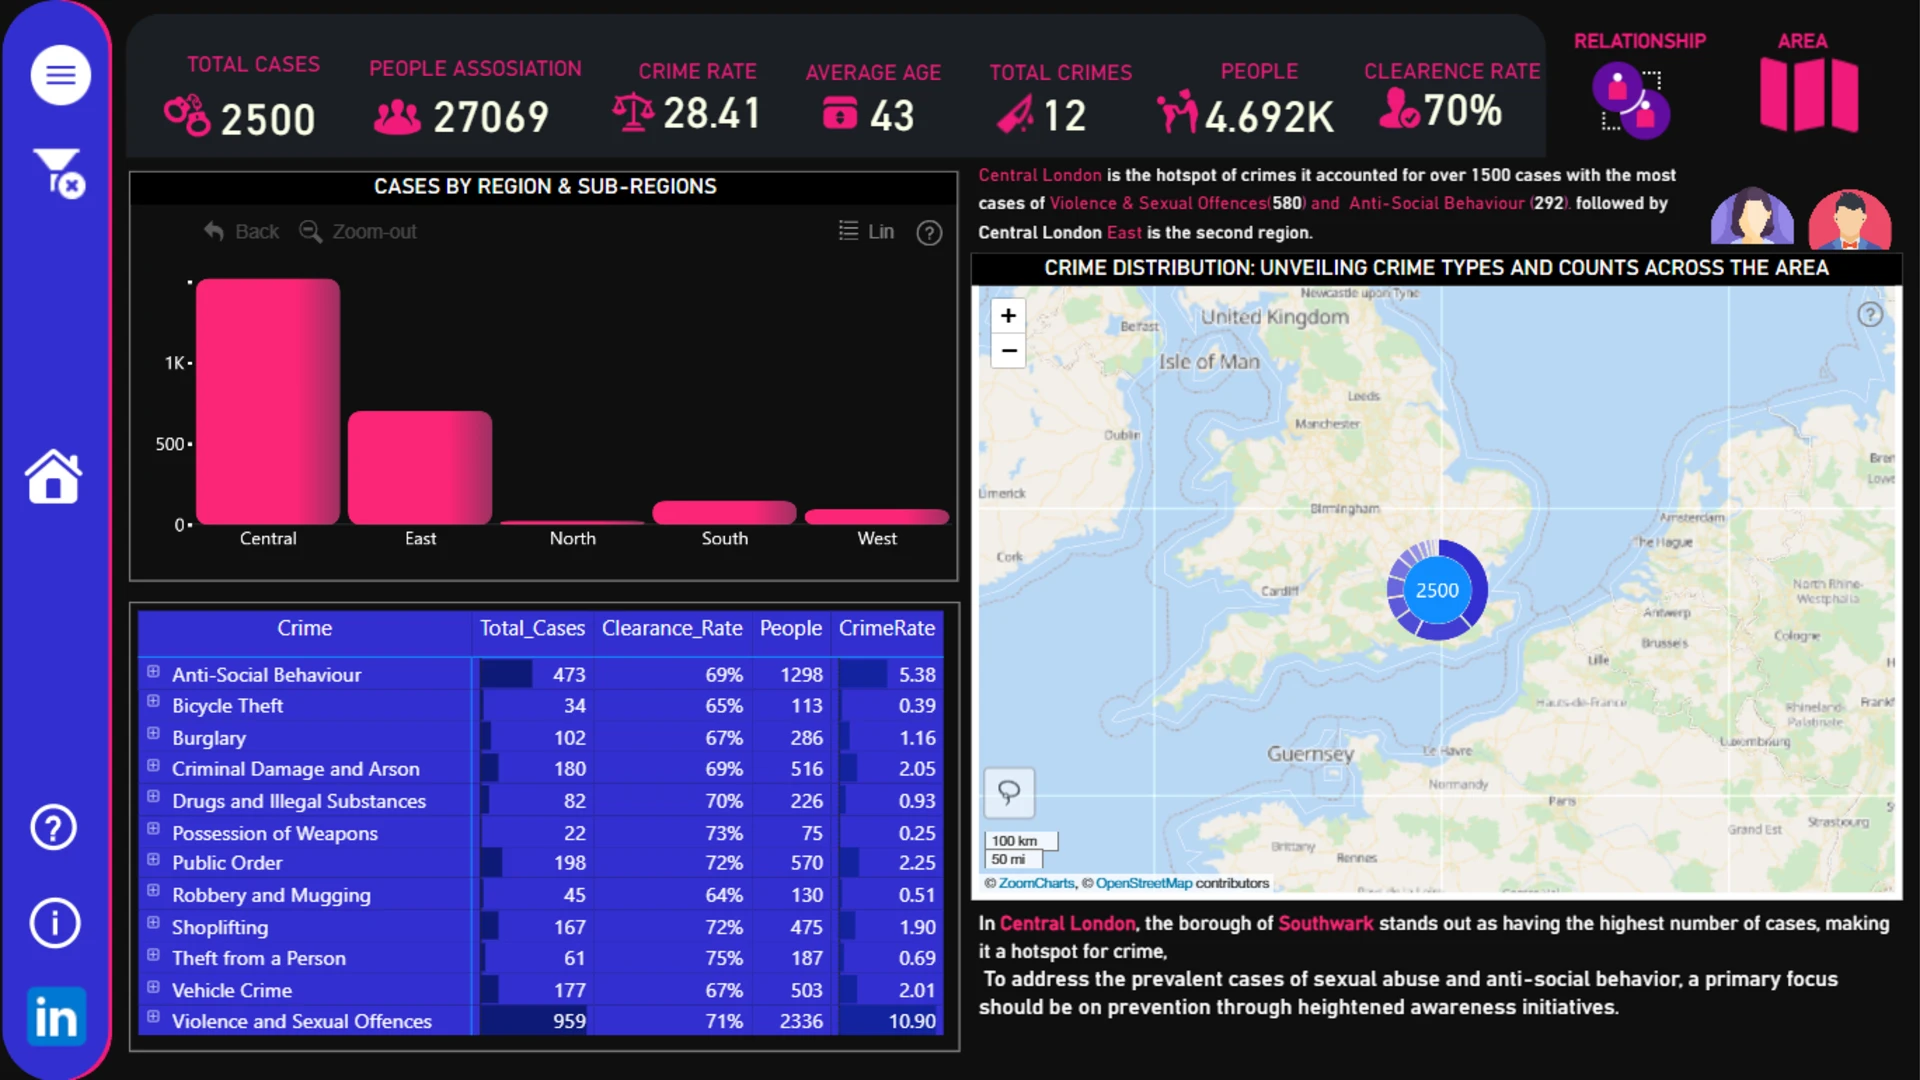
🍂 Autumn emerges as the peak season, particularly in September to November, with a spike in crime rates. Central London, notably Southwark borough, stands out as a hotspot, reporting over 1500 cases, predominantly Violence & Sexual Offences (580) and Anti-Social Behaviour (292).
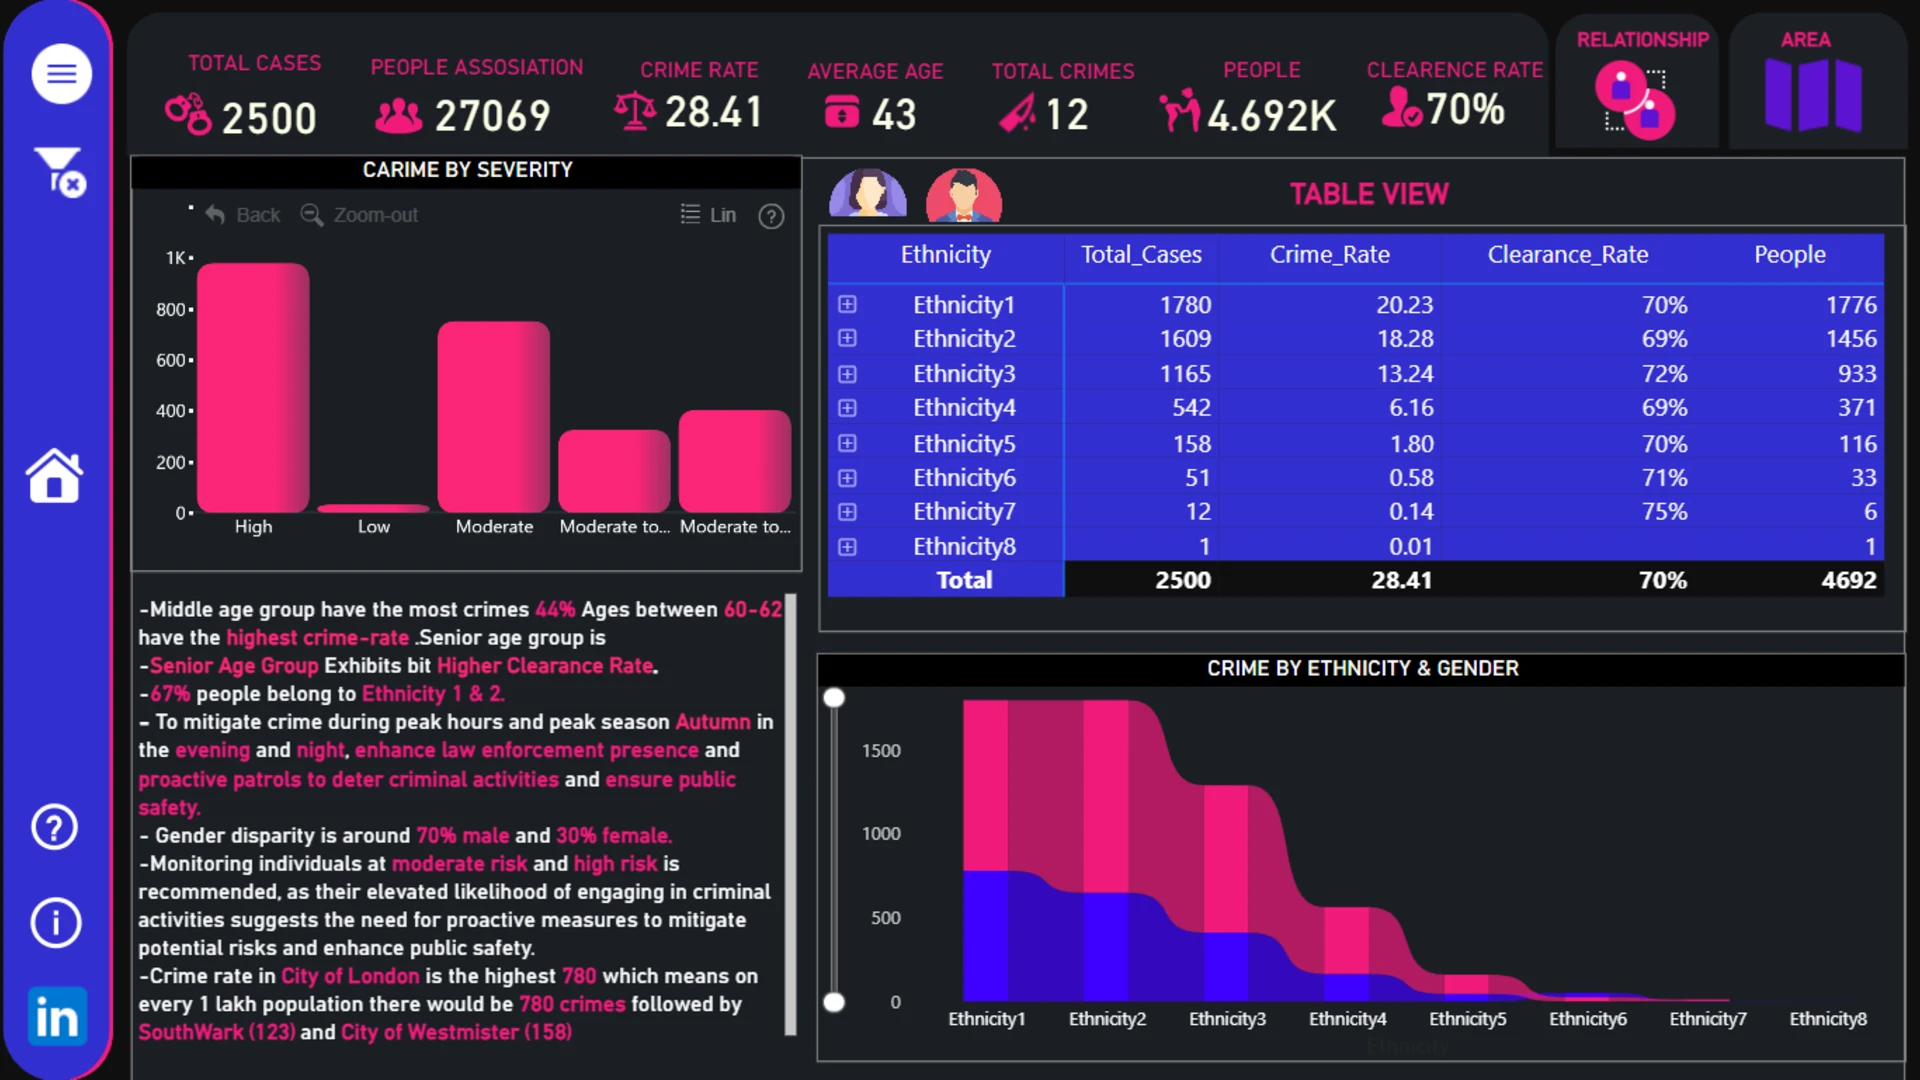
📍 To address this, heightened awareness initiatives, especially against sexual abuse and anti-social behavior, are crucial. Proactive law enforcement measures during peak hours and seasons are recommended to ensure public safety. Demographically, the middle age group represents 44% of crimes, with ages 60-62 showing the highest crime rate. Seniors exhibit a slightly higher Clearance Rate. About 67% belong to Ethnicities 1 & 2, highlighting the need for culturally sensitive interventions.
🚓 City-specific data points to the City of London having the highest crime rate (780 per 1 lakh population), followed by Southwark (123) and City of Westminster (158). Tailored strategies for these areas are essential to curb crime effectively. Gender-wise, around 70% of crimes involve males, signaling a notable disparity. Monitoring individuals at moderate and high risk is crucial for proactive crime prevention.



4U Report Challenges
Participate in data challenges, build and submit reports to get free template downloads.
Join CommunityMobile view allows you to interact with the report. To Download the template please switch to desktop view.

How to use a PBIX template
Preview the interactive report, download the PBIX file, open it in Power BI Desktop, and replace the same data connection with your own dataset.
Preview and download
Explore the report online and download the PBIX template file.
Open in Power BI Desktop
Open the downloaded PBIX file in Power BI Desktop.
Connect your data
Replace the sample data source with your own dataset.
Refresh and adjust
Refresh the model and update fields or visual were needed.
Save and share
Save your report and publish it for your audience.


