2868
Power BI Supply Chain Risk & Performance Dashboard
Power BI Supply Chain Risk & Performance Dashboard
More Report pages
Report Author: Akindele Omolayo
2868
Share template with others
Summary
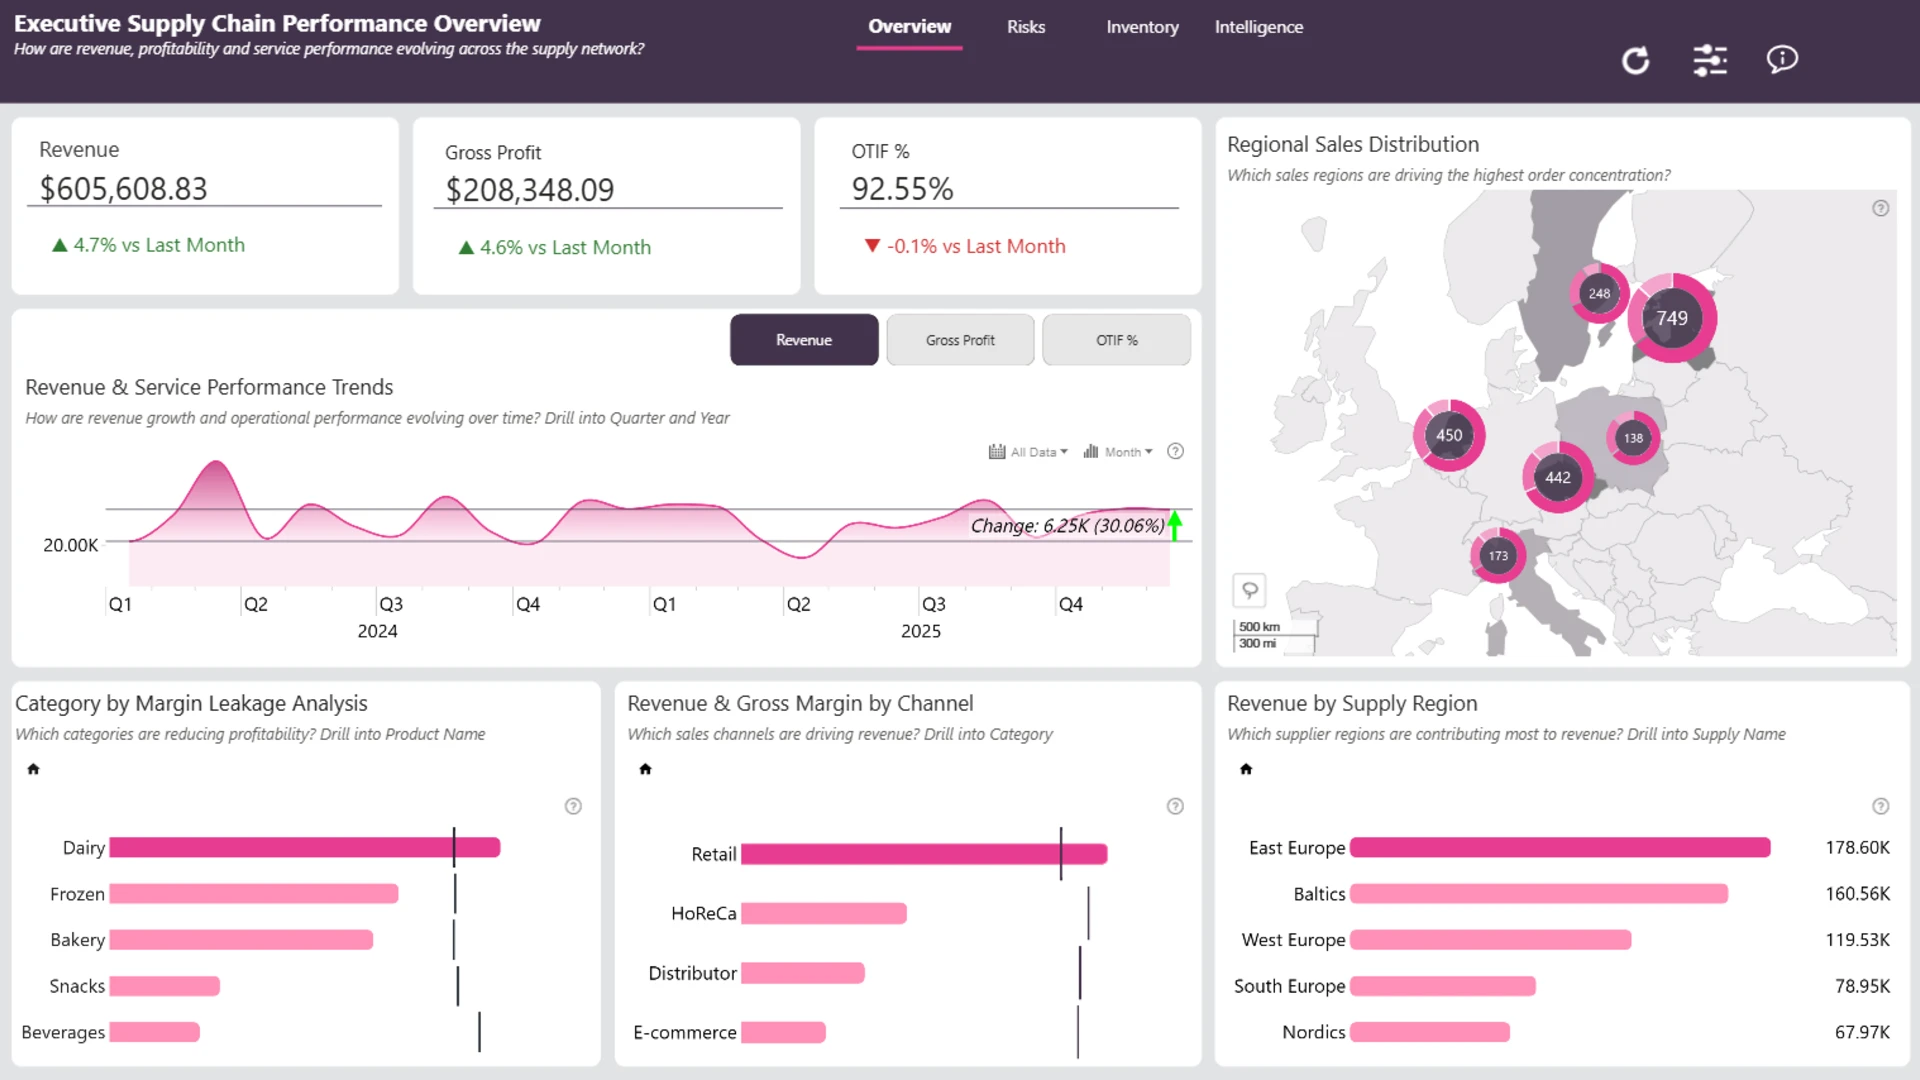
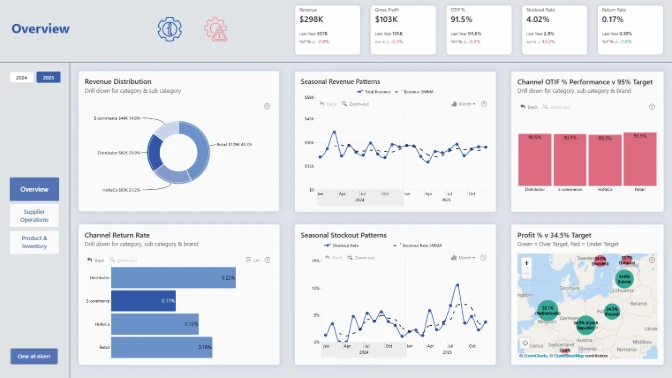
This Power BI food and beverage supply chain dashboard helps operations, logistics, and business teams monitor distribution performance, inventory health, supplier activity, and operational risk.
The report connects financial and operational KPIs, including revenue, gross profit, OTIF, late deliveries, stockouts, returns, waste, and customer fulfillment. It was created by Akindele Omolayo.
Key Insights of the Power BI Food & Beverage Supply Chain KPI Dashboard
The dashboard is organized into focused views for performance overview, risk monitoring, inventory health, and business intelligence. Its main areas of analysis include:
- Distribution performance: monitor revenue, gross profit, OTIF, late deliveries, and customer fulfillment
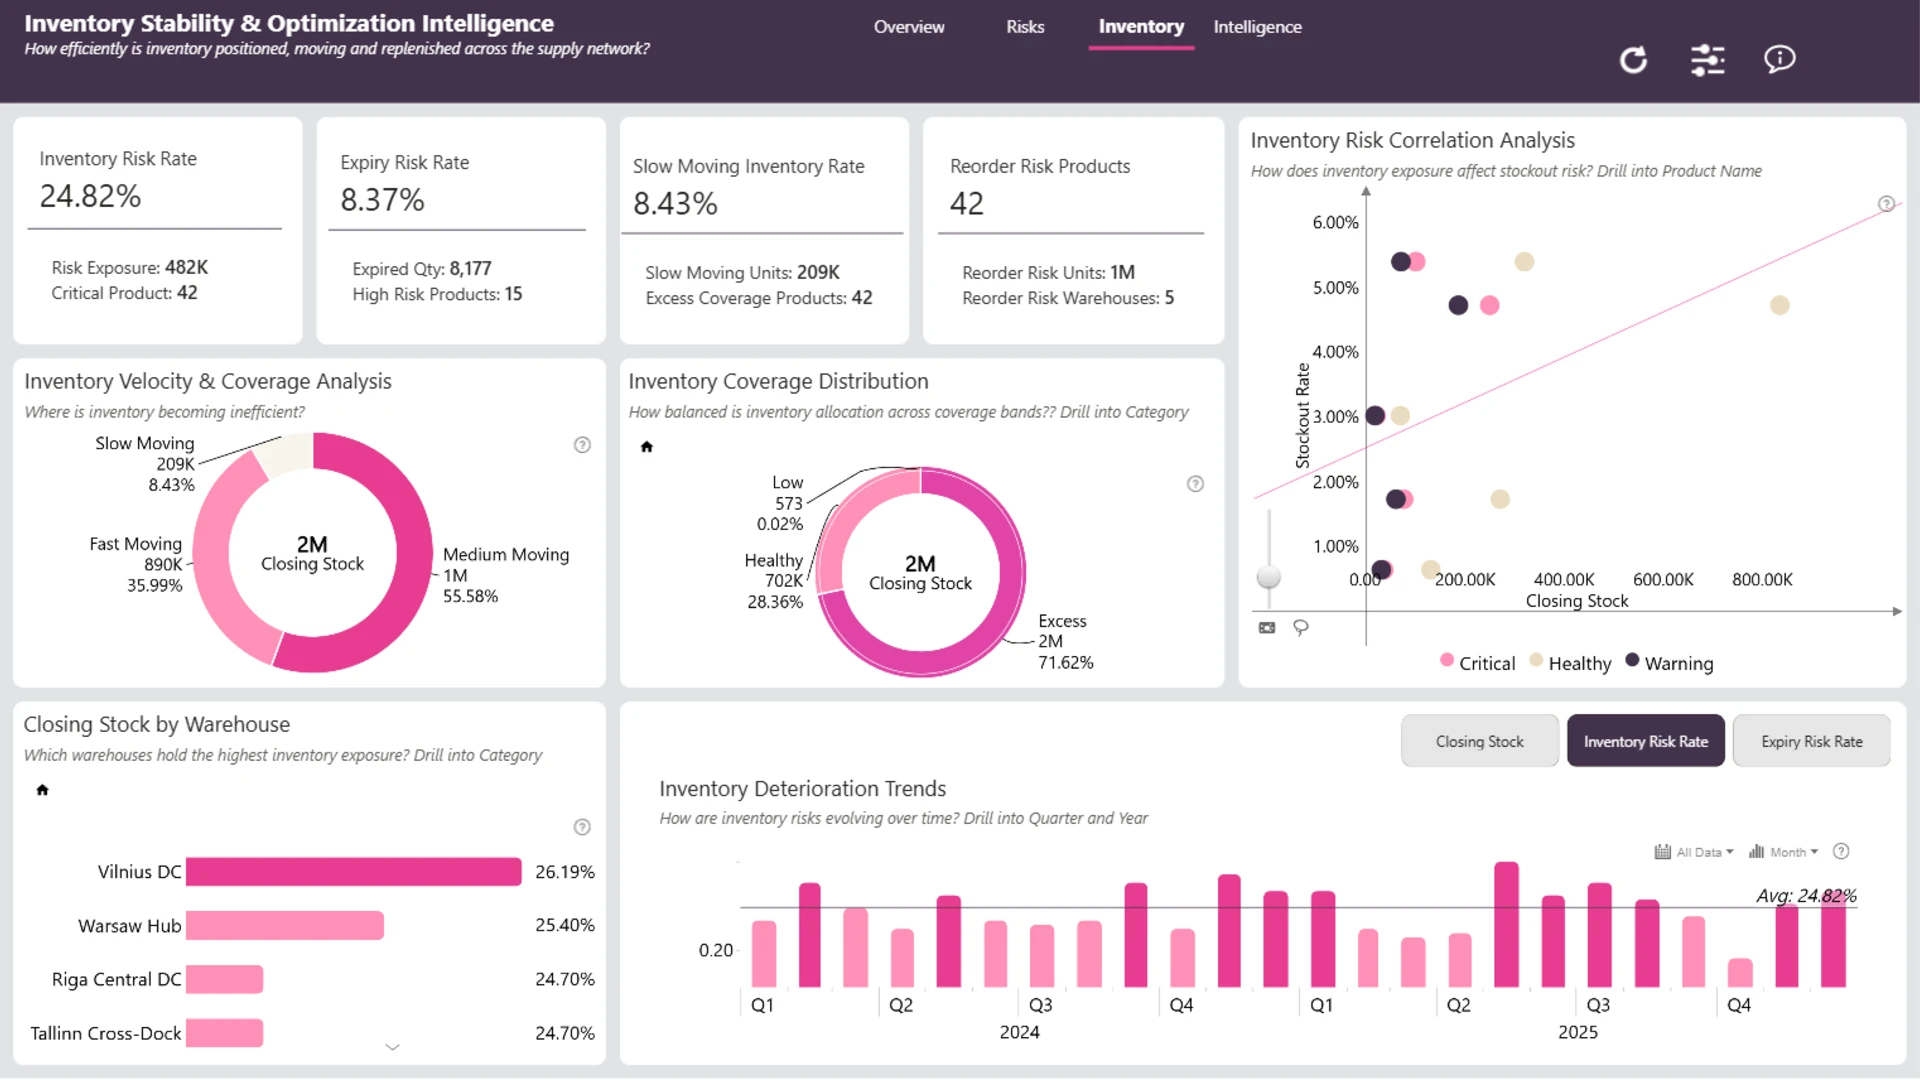
- Inventory health: identify stockouts, product-availability issues, and other inventory disruptions
- Supplier and warehouse performance: compare results across suppliers, warehouses, products, channels, and time periods
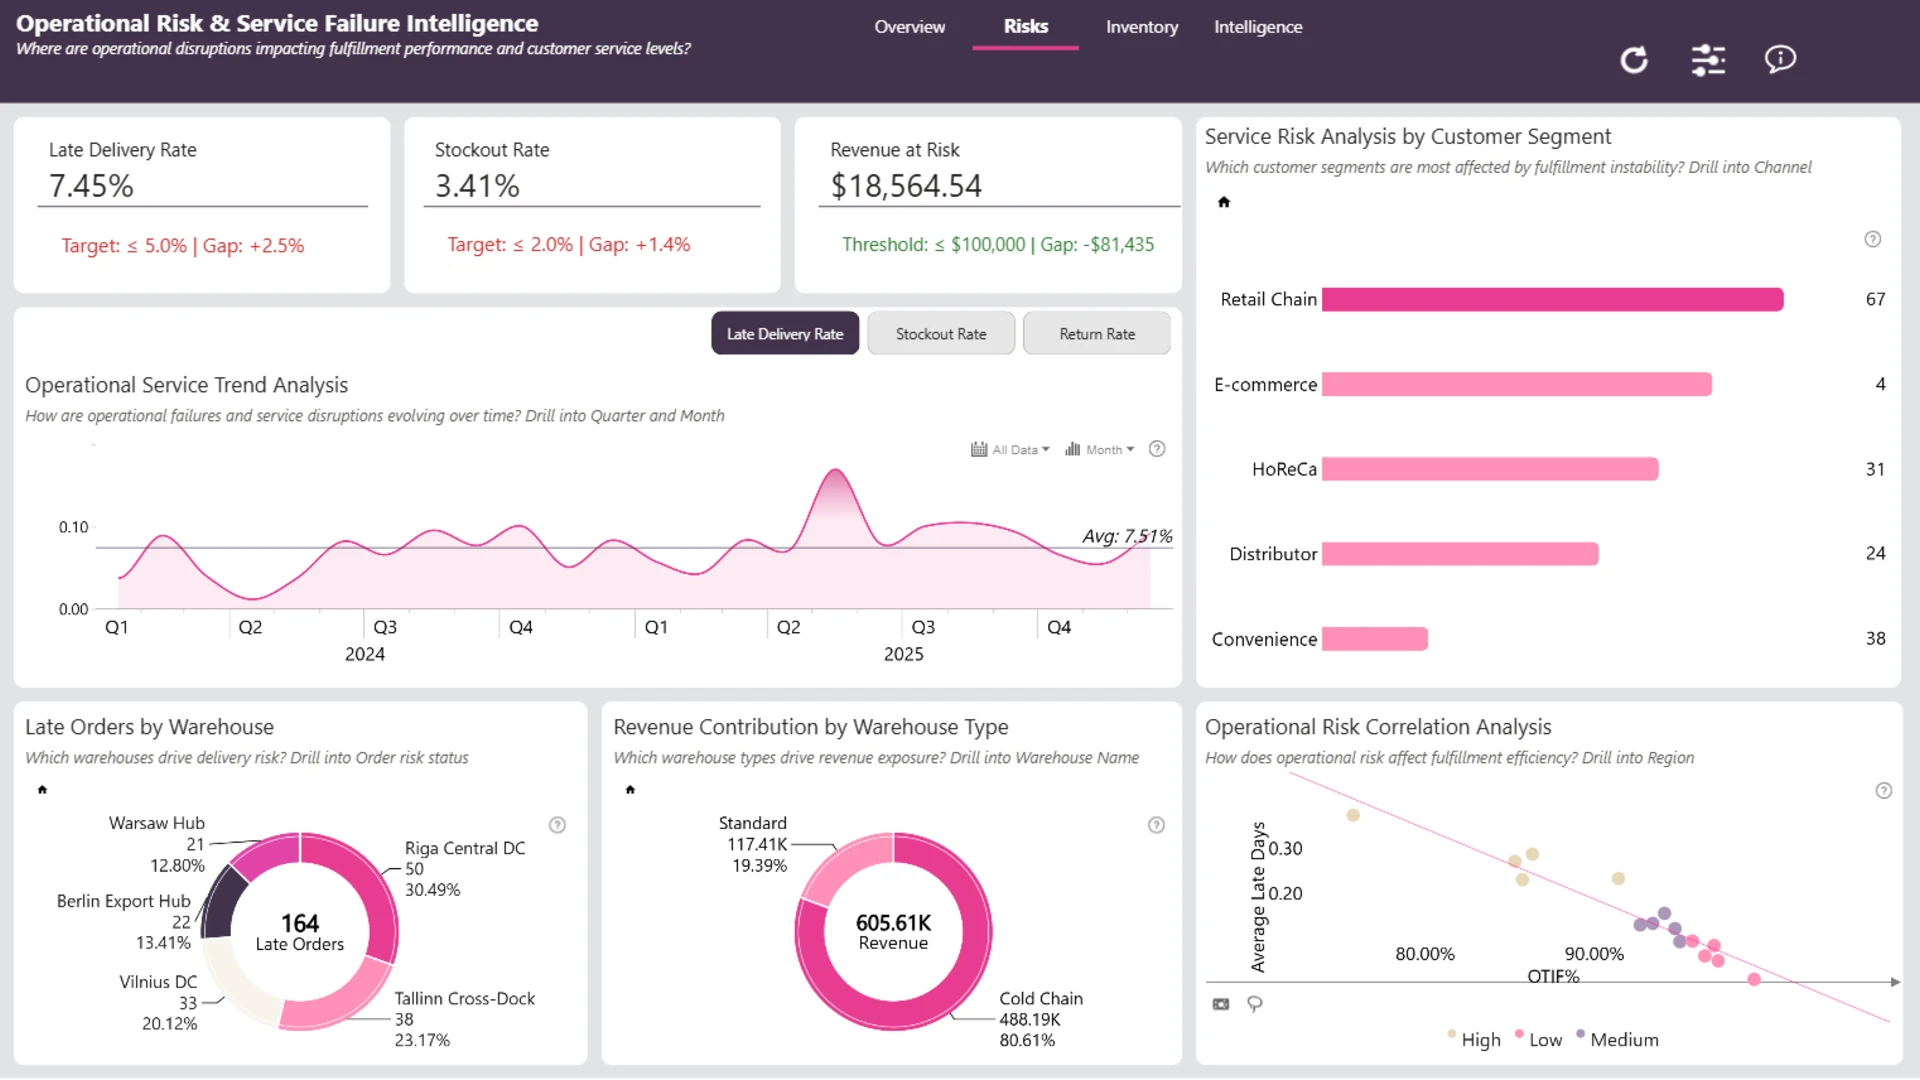
- Operational risk: investigate returns, waste, service issues, late deliveries, and related supply chain risks
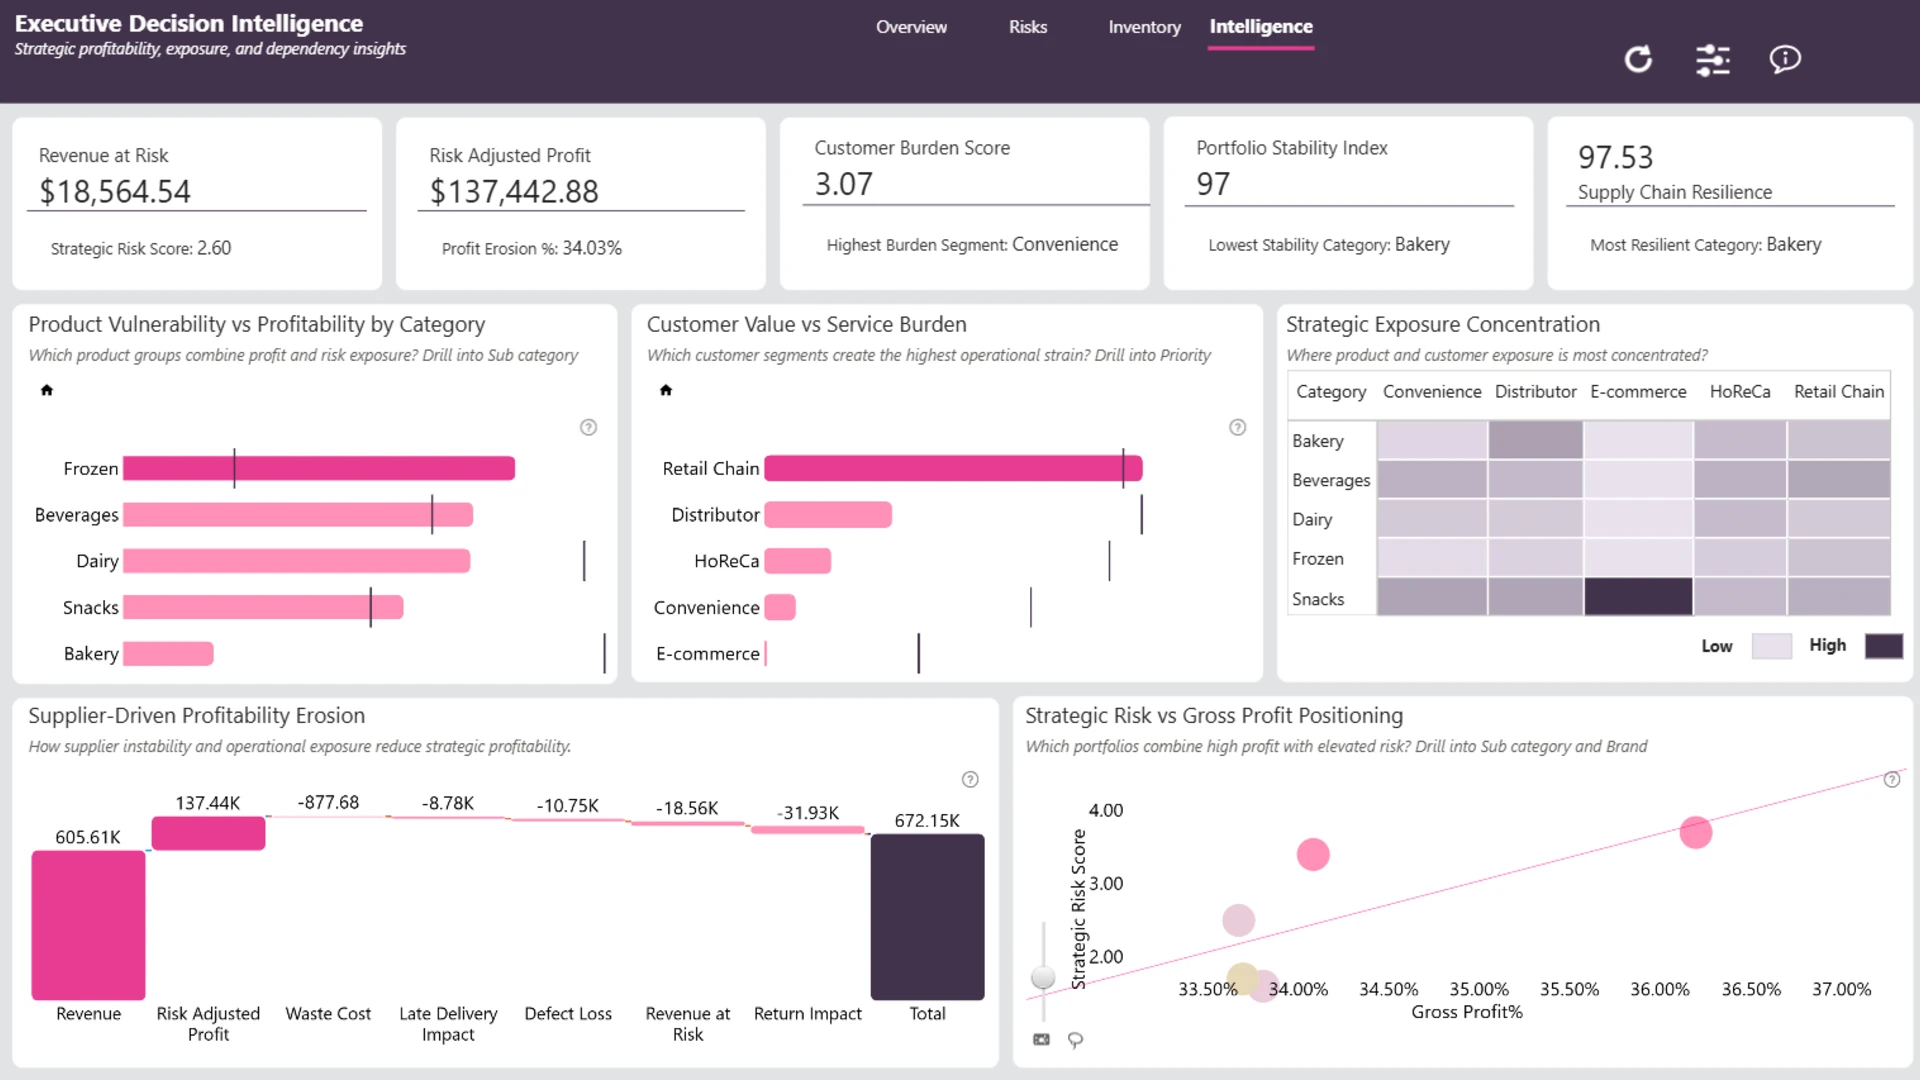
- Profitability impact: examine how operational problems affect revenue, gross profit, and fulfillment performance
Interactive scatter, waterfall, combo bar, map, timeline, and donut visuals provide several ways to analyze the supply chain. Cross-filtering and drill-down actions help users move from top-level KPIs to individual suppliers, warehouses, products, customer channels, and periods.
How to Use This Power BI Food & Beverage Supply Chain KPI Dashboard
Click any active chart or map element to filter the related supply chain data. Compare suppliers, warehouses, products, channels, and time periods, then drill into stockouts, returns, waste, service issues, or late-delivery patterns.
Download the PBIX template to examine the report structure, calculations, visuals, and KPI logic in Power BI Desktop. Connect it to your own supply chain data and adjust the model to create an inventory, logistics, supplier, or distribution monitoring solution for your organization.
ZoomCharts visuals used






4U Report Challenges
Participate in data challenges, build and submit reports to get free template downloads.
Join CommunityMobile view allows you to interact with the report. To Download the template please switch to desktop view.
How to use a PBIX template
Preview the interactive report, download the PBIX file, open it in Power BI Desktop, and replace the same data connection with your own dataset.
Preview and download
Explore the report online and download the PBIX template file.
Open in Power BI Desktop
Open the downloaded PBIX file in Power BI Desktop.
Connect your data
Replace the sample data source with your own dataset.
Refresh and adjust
Refresh the model and update fields or visual were needed.
Save and share
Save your report and publish it for your audience.


