557
Supply chain analisys
Supply chain analisys
Report Author: Milan Isailovic
557
Share template with others
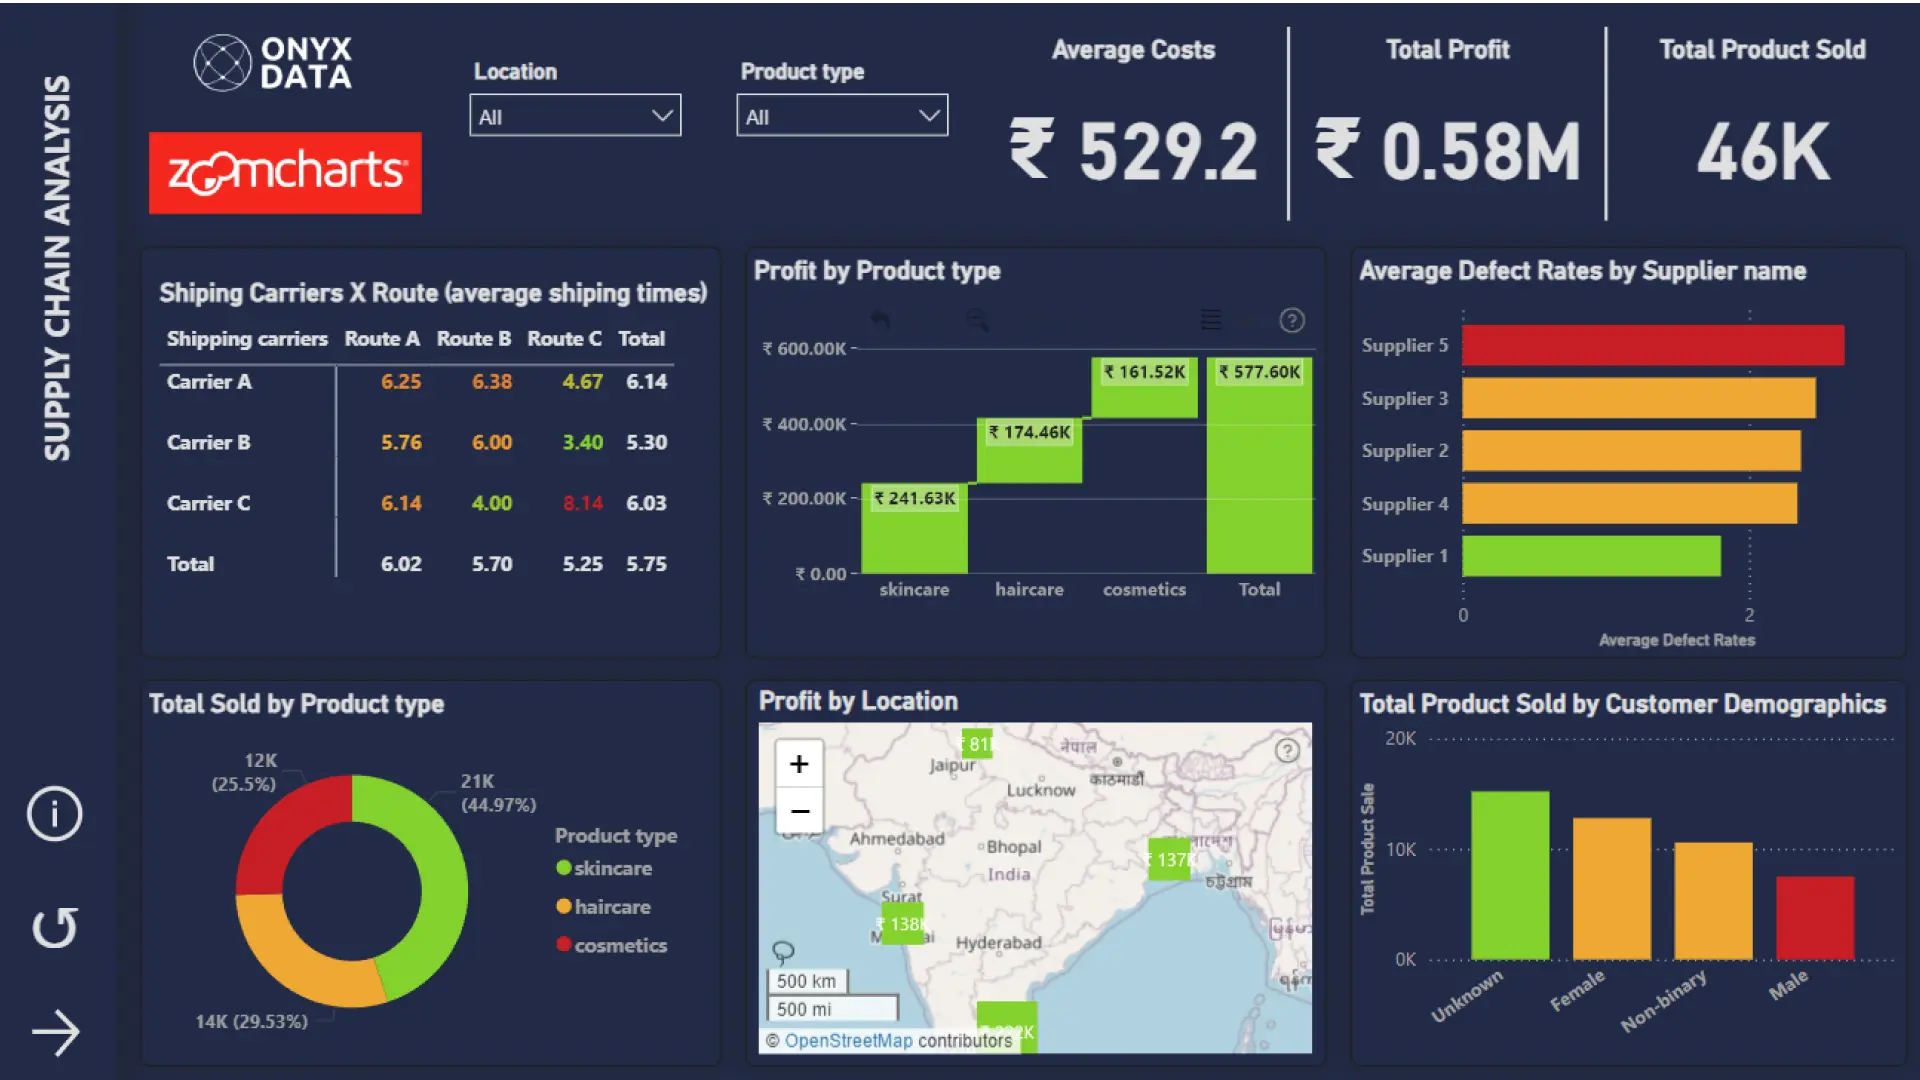
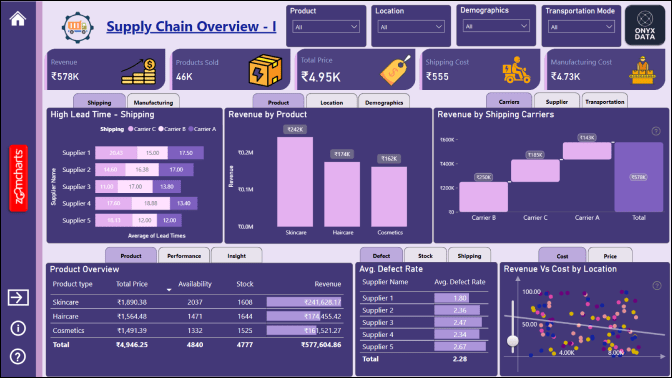
Report submitted for Onyx Data DataDNA ZoomCharts Mini Challenge, November 2024. The report is based on the Supply Chain Analysis dataset and includes ZoomCharts custom Drill Down PRO visuals for Power BI.
Author's description:
This Power BI report provides essential insights for the supply chain management team, covering key areas like inventory levels, supplier performance, shipping times, and quality control metrics. Report Highlights:
Inventory Management: Track stock levels and lead times to optimize inventory.
Supplier and Production: Evaluate supplier reliability and production volumes.
Quality Control: Monitor inspection results and defect rates.
Logistics Optimization: Assess shipping times and routes for efficiency.
Revenue Insights: Analyze product performance and revenue.
This report helps the team identify issues, optimize operations, and make data-driven decisions to enhance supply chain performance.
4U Report Challenges
Participate in data challenges, build and submit reports to get free template downloads.
Join CommunityMobile view allows you to interact with the report. To Download the template please switch to desktop view.
Was this helpful? Thank you for your feedback!
Sorry about that.
How can we improve it?