1030
Student Performance Power BI Report 8
Student Performance Power BI Report 8
More Report pages
Report Author: Egbe Jonathan
1030
Share template with others
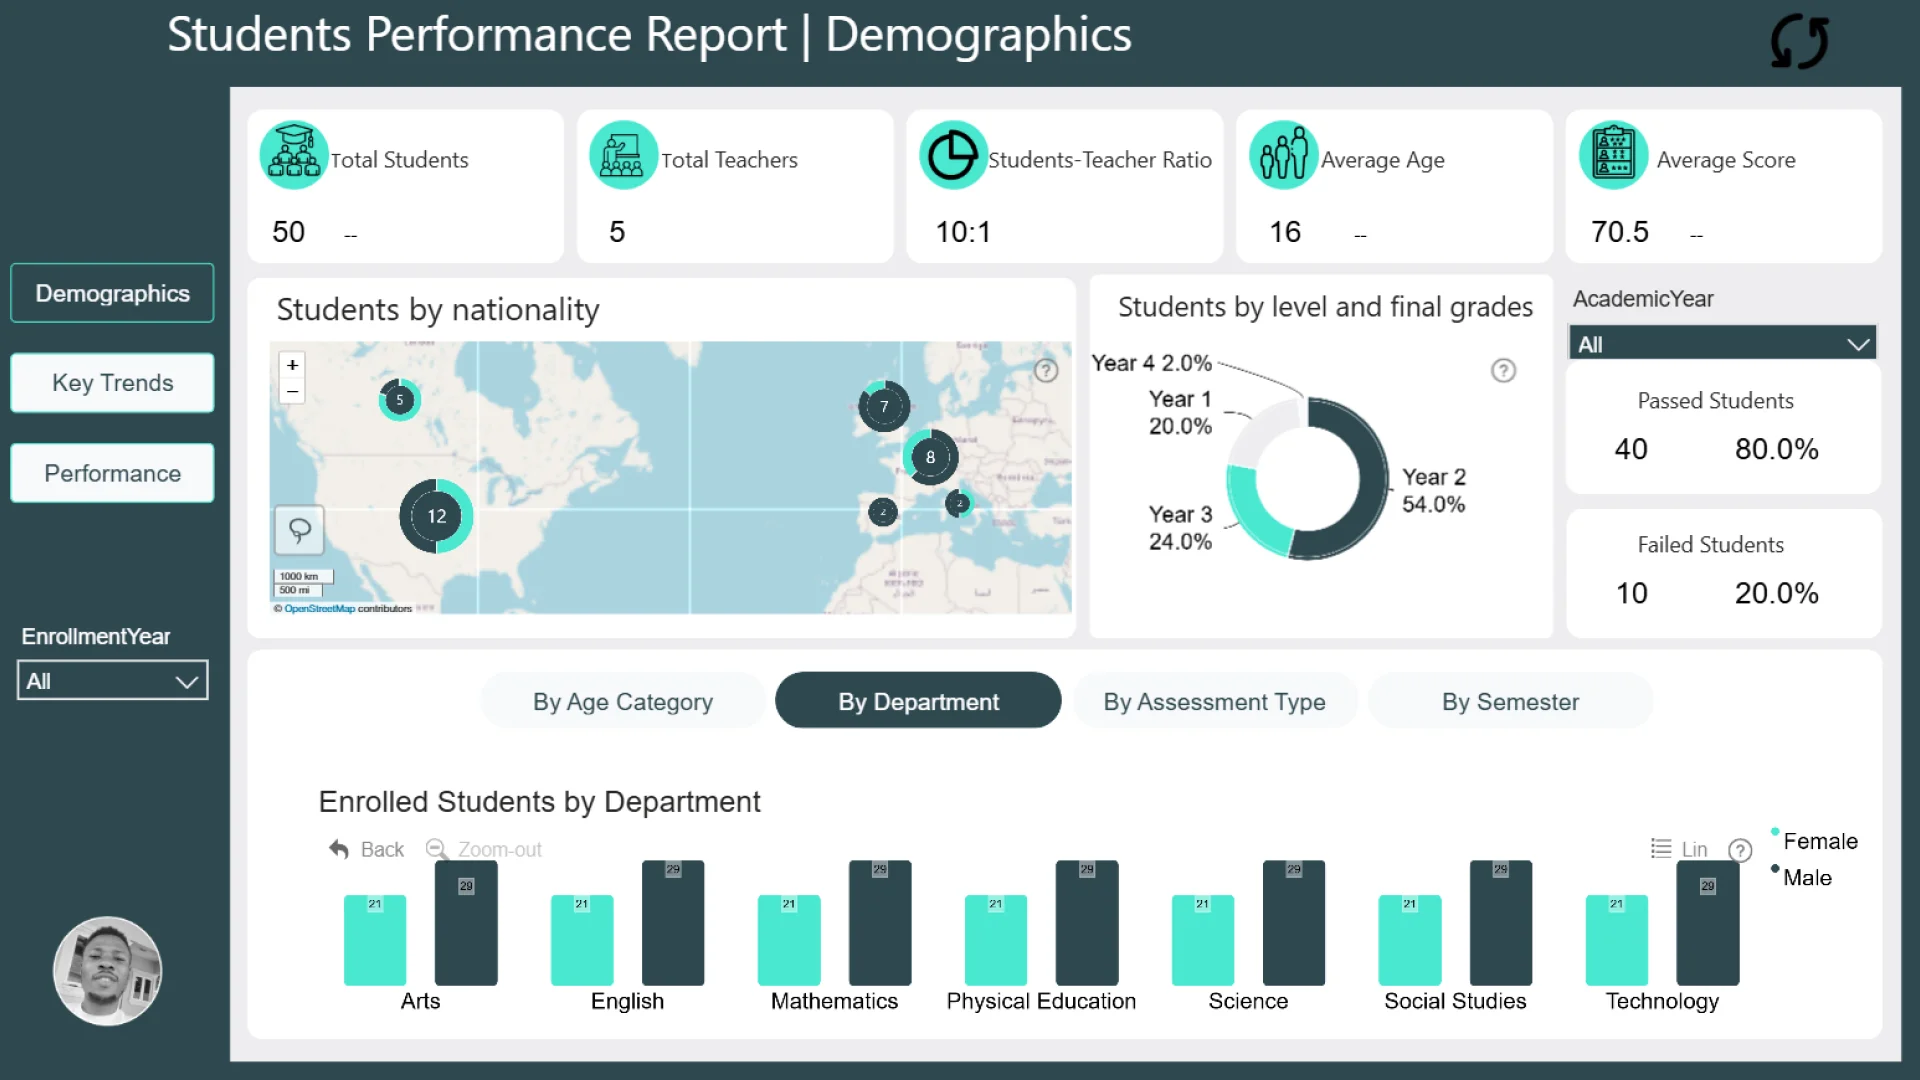
This Power BI report uses the Education/Student Performance dataset and features ZoomCharts Drill Down PRO custom visuals for Power BI. It was submitted to the FP20 Analytics ZoomCharts Data Challenge 31 in October 2025.
Author Description:
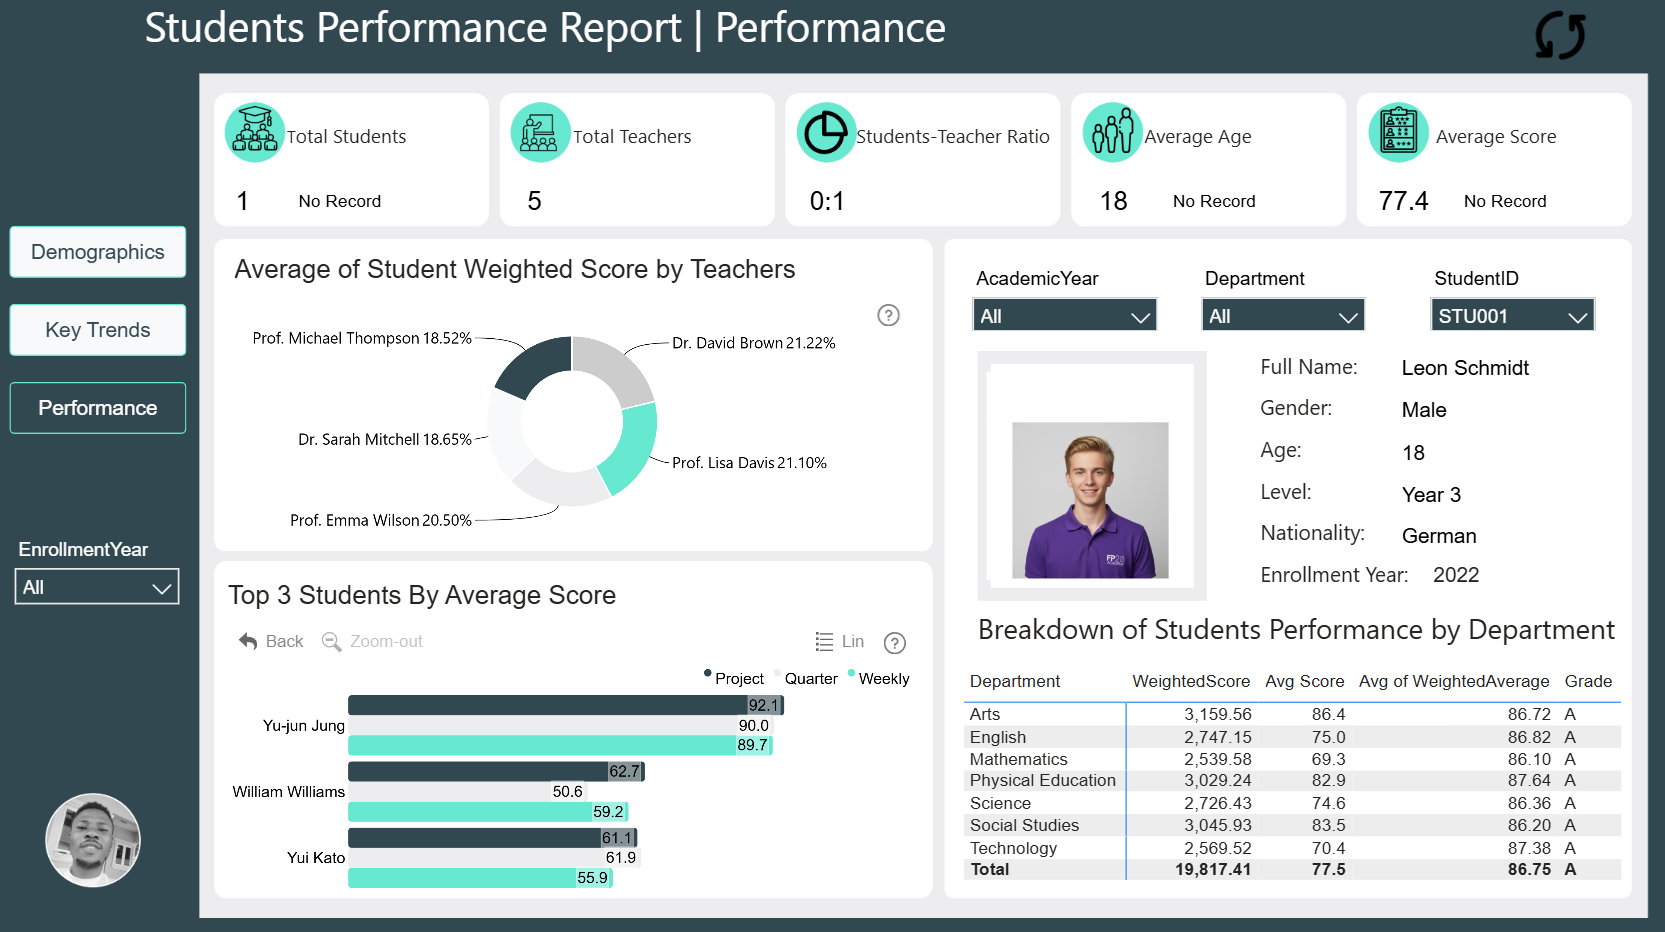
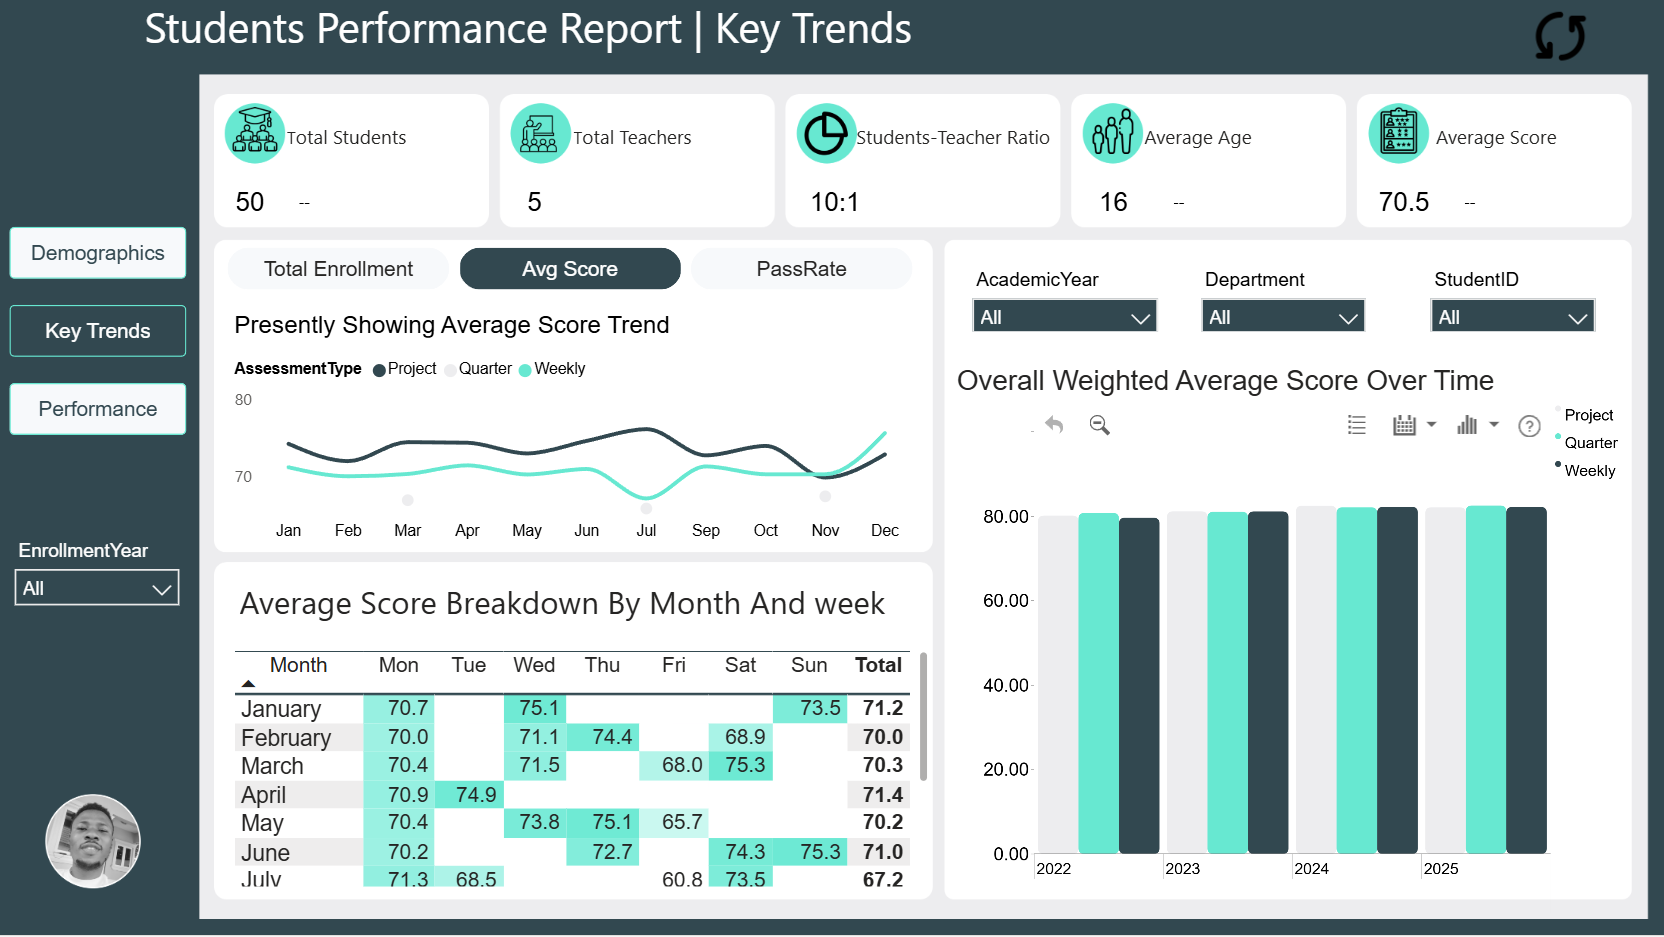
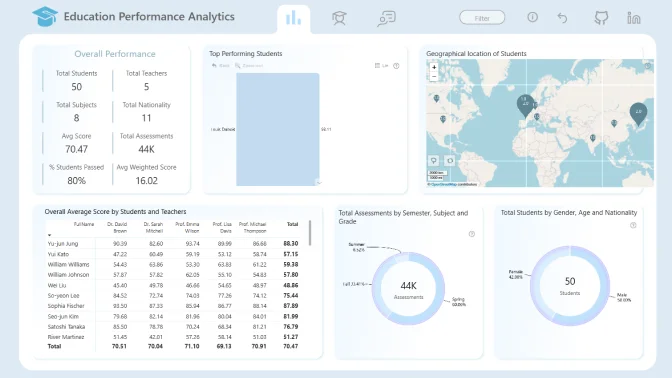
This Power BI report analyzes student performance data to identify key factors affecting academic success across subjects and demographics. It highlights KPIs such as average scores, pass rates, and subject-level performance using interactive visuals and DAX measures. Insights show how attendance, study time, and parental education influence results, helping educators make data-driven decisions to improve learning outcomes and monitor progress effectively.
ZoomCharts visuals used
4U Report Challenges
Participate in data challenges, build and submit reports to get free template downloads.
Join CommunityMobile view allows you to interact with the report. To Download the template please switch to desktop view.
Was this helpful? Thank you for your feedback!
Sorry about that.
How can we improve it?