718
Sport Injury Analysis
Sport Injury Analysis
Report Author: Chaw Thiri San
718
Share template with others
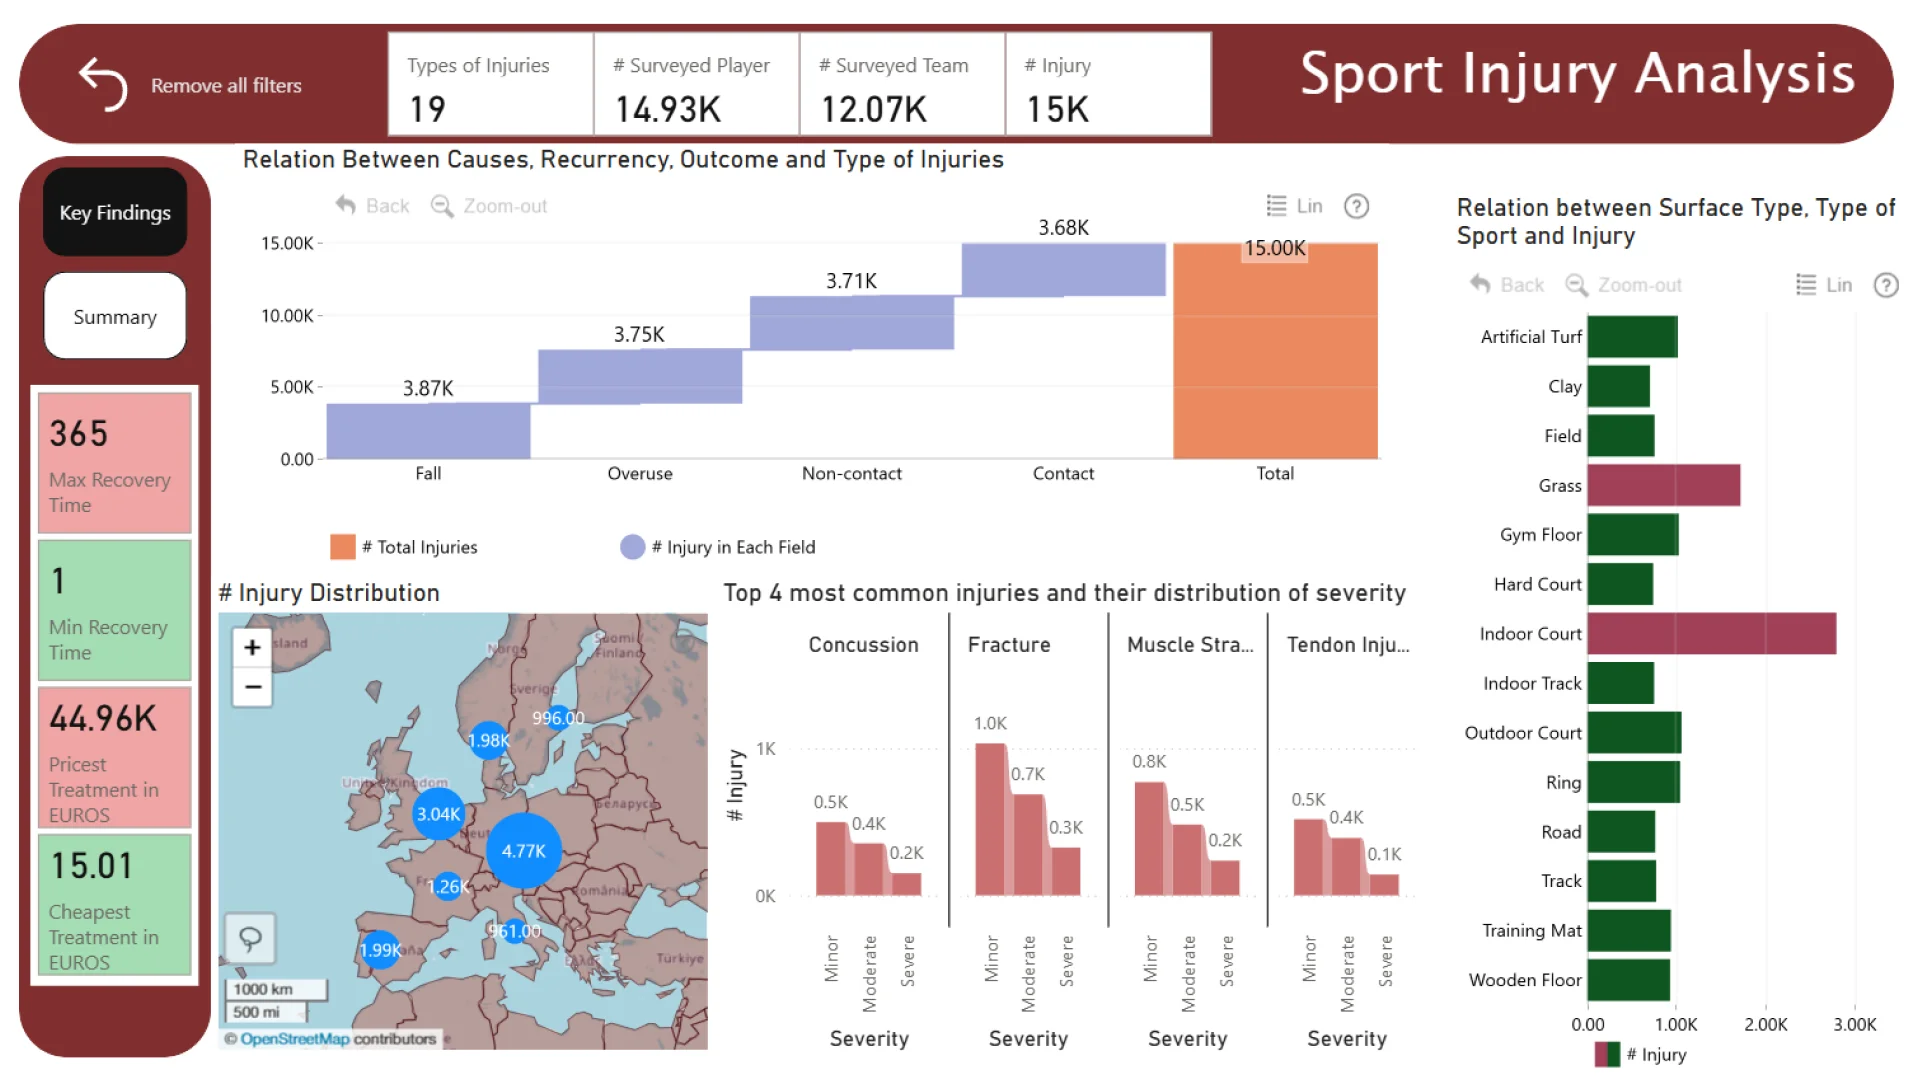
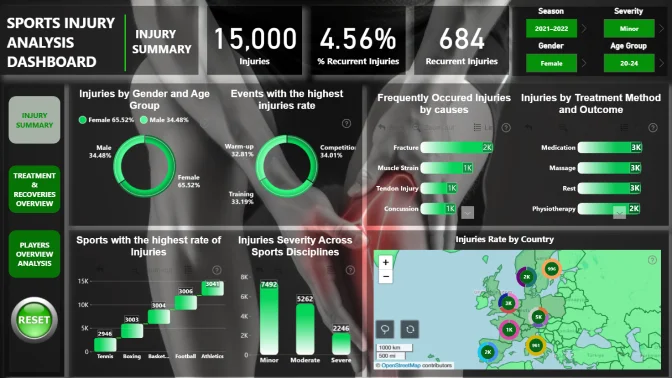
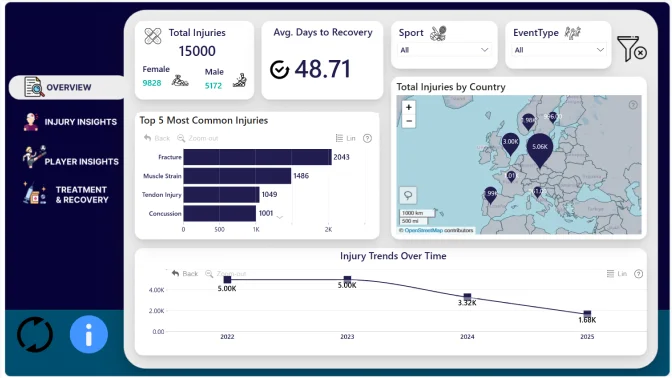
This Power BI report uses the Athlete Health and Injury dataset and features ZoomCharts Drill Down PRO custom visuals for Power BI. It was submitted to the FP20 Analytics ZoomCharts Data Challenge in August 2025.
Author's Description:
There is no pattern between injury rate and coaches. Indoor courts are the places with highest number of accidents. 2022-2023 was the season with peak number of injuries at #5k. Overall, female are more prone to injury than males.
ZoomCharts visuals used
4U Report Challenges
Participate in data challenges, build and submit reports to get free template downloads.
Join CommunityMobile view allows you to interact with the report. To Download the template please switch to desktop view.
Was this helpful? Thank you for your feedback!
Sorry about that.
How can we improve it?