902
Sales Rep Performance Dashboard
Sales Rep Performance Dashboard
Report Author: Steven Stanford
902
Share template with others
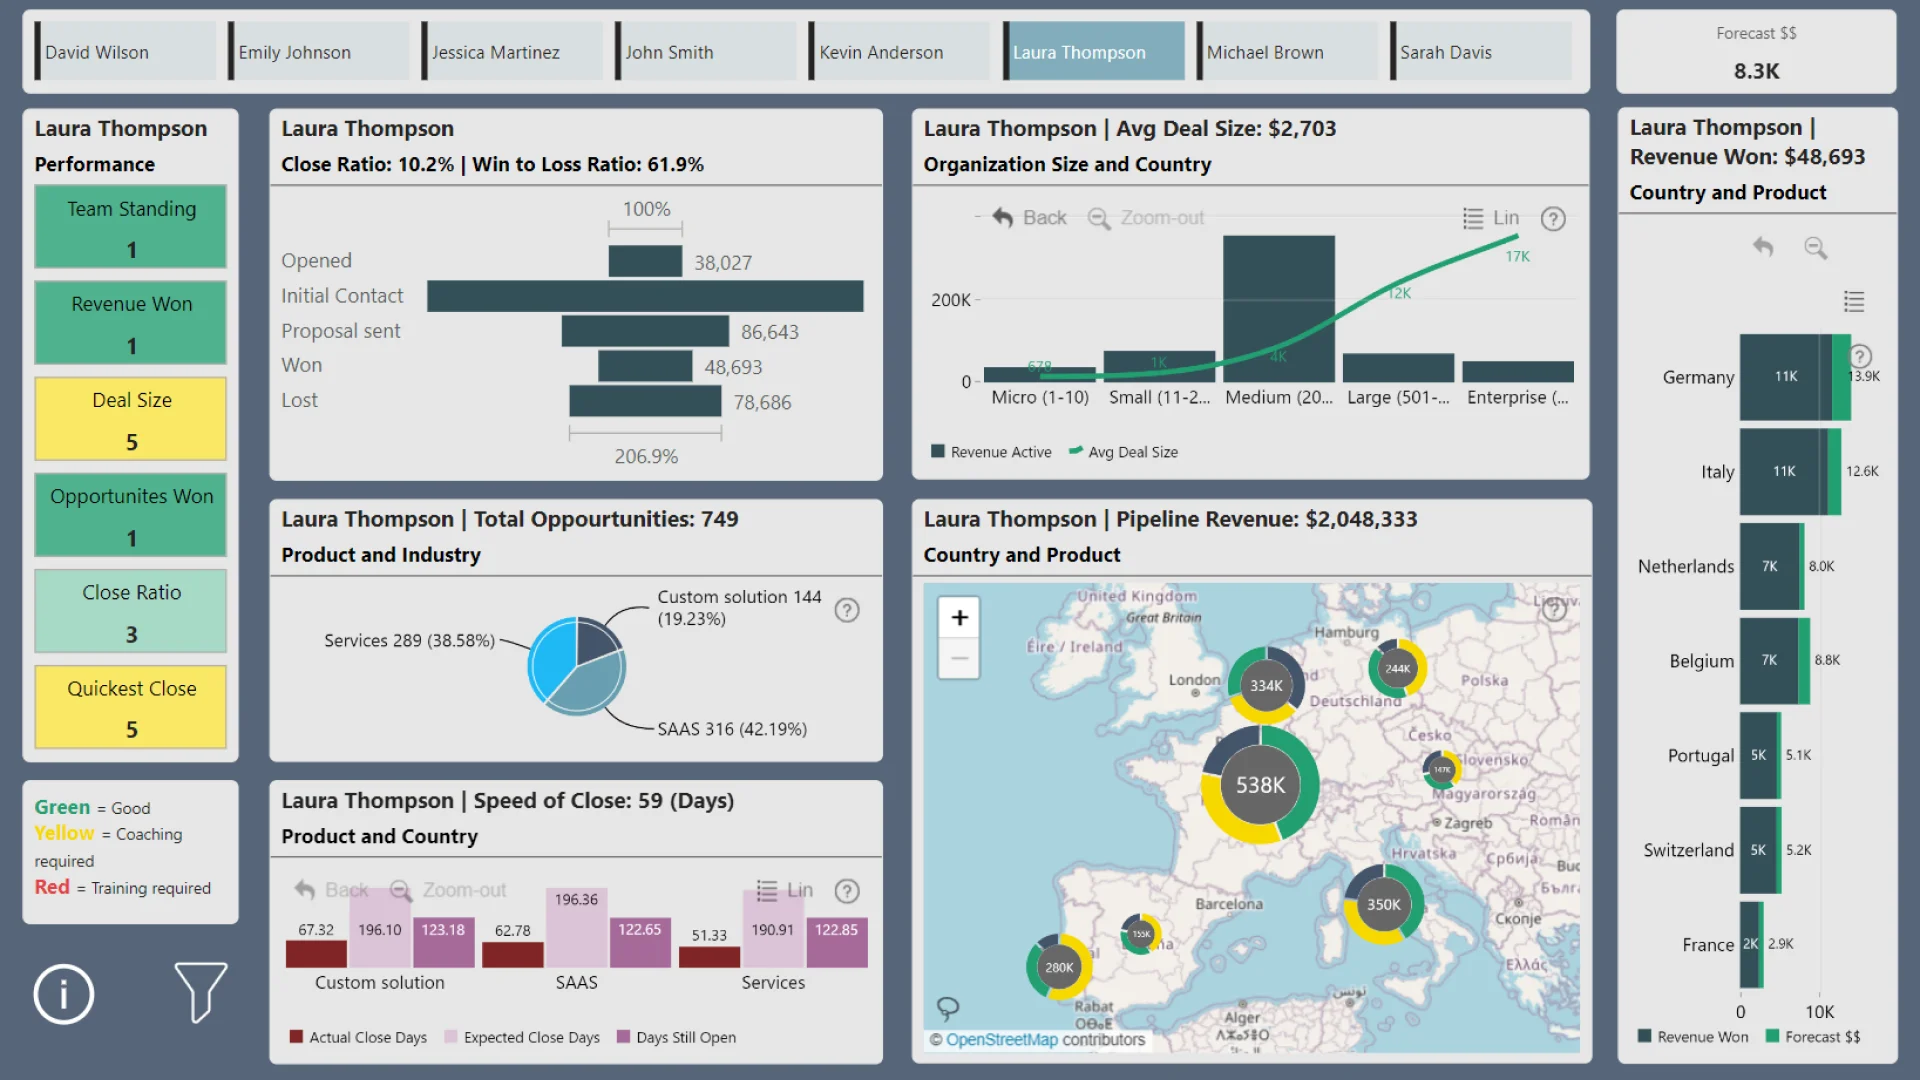
Report submitted for FP20 Analytics ZoomCharts Challenge 17 (July 2024). The report was built with the CRM & Sales Pipeline Analysis dataset and includes ZoomCharts custom Drill Down PRO visuals for Power BI.
Author's description:
This report aimed to understand the relative performance of owners across new sales and customer portfolio growth. Supported by analysis of Owner performance and activity across country, and organisations. With a focus on Revenue, Win / Loss Ratios, Deal Size, Close Speed, Customer Retention / Replacement. The data highlighted the hunters and farmers in the team. Confirming yet again that teams where BDM and Customer retention work is required of an individual mangers need to pay close attention to metrics when assessing performance. ie Based on BDM performance David Wilson would be sacked however his customer loss rate was one of the lowest. Some good data, the status category helped provide context to the records with blank stage fields.
ZoomCharts visuals used





4U Report Challenges
Participate in data challenges, build and submit reports to get free template downloads.
Join CommunityMobile view allows you to interact with the report. To Download the template please switch to desktop view.
How to use a PBIX template
Preview the interactive report, download the PBIX file, open it in Power BI Desktop, and replace the same data connection with your own dataset.
Preview and download
Explore the report online and download the PBIX template file.
Open in Power BI Desktop
Open the downloaded PBIX file in Power BI Desktop.
Connect your data
Replace the sample data source with your own dataset.
Refresh and adjust
Refresh the model and update fields or visual were needed.
Save and share
Save your report and publish it for your audience.


