2130
Power BI Sales Pipeline Dashboard Template
Power BI Sales Pipeline Dashboard Template
More Report pages
Report Author: Aakash M
2130
Share template with others
Summary
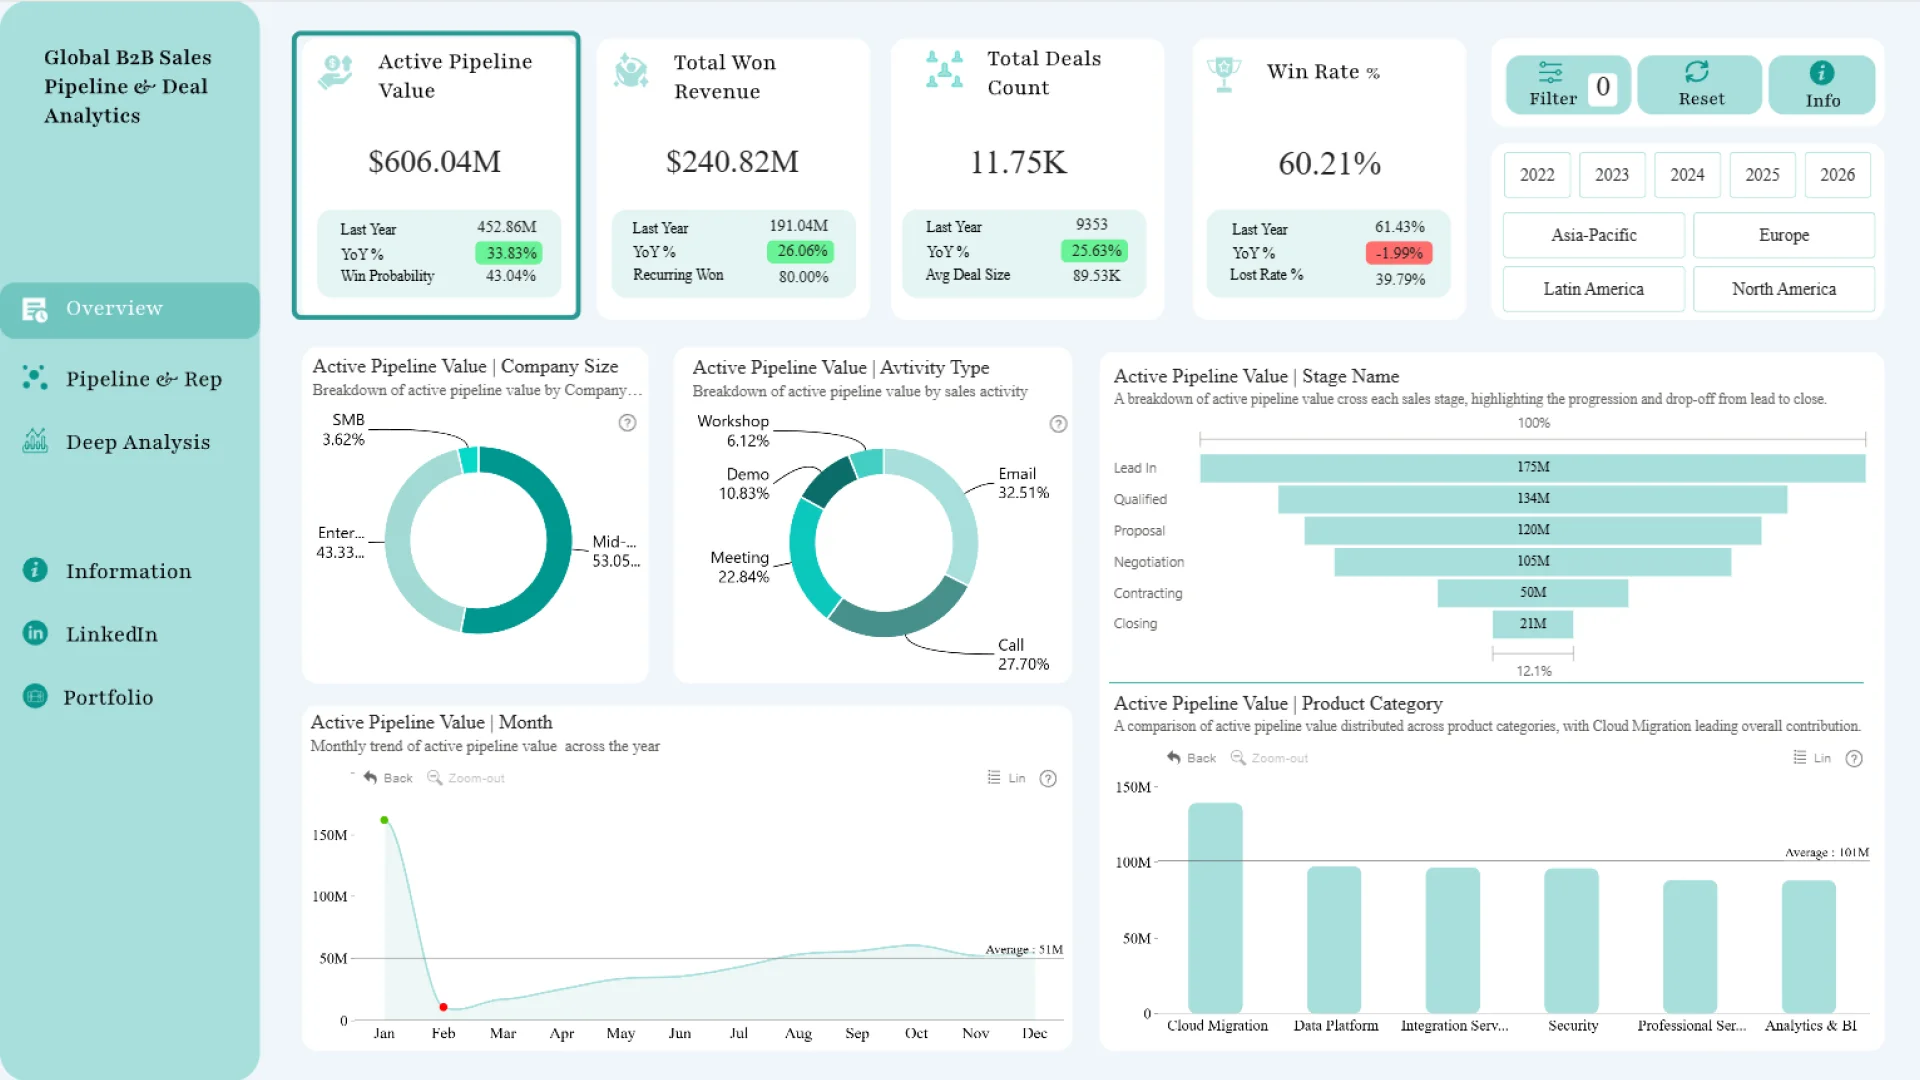
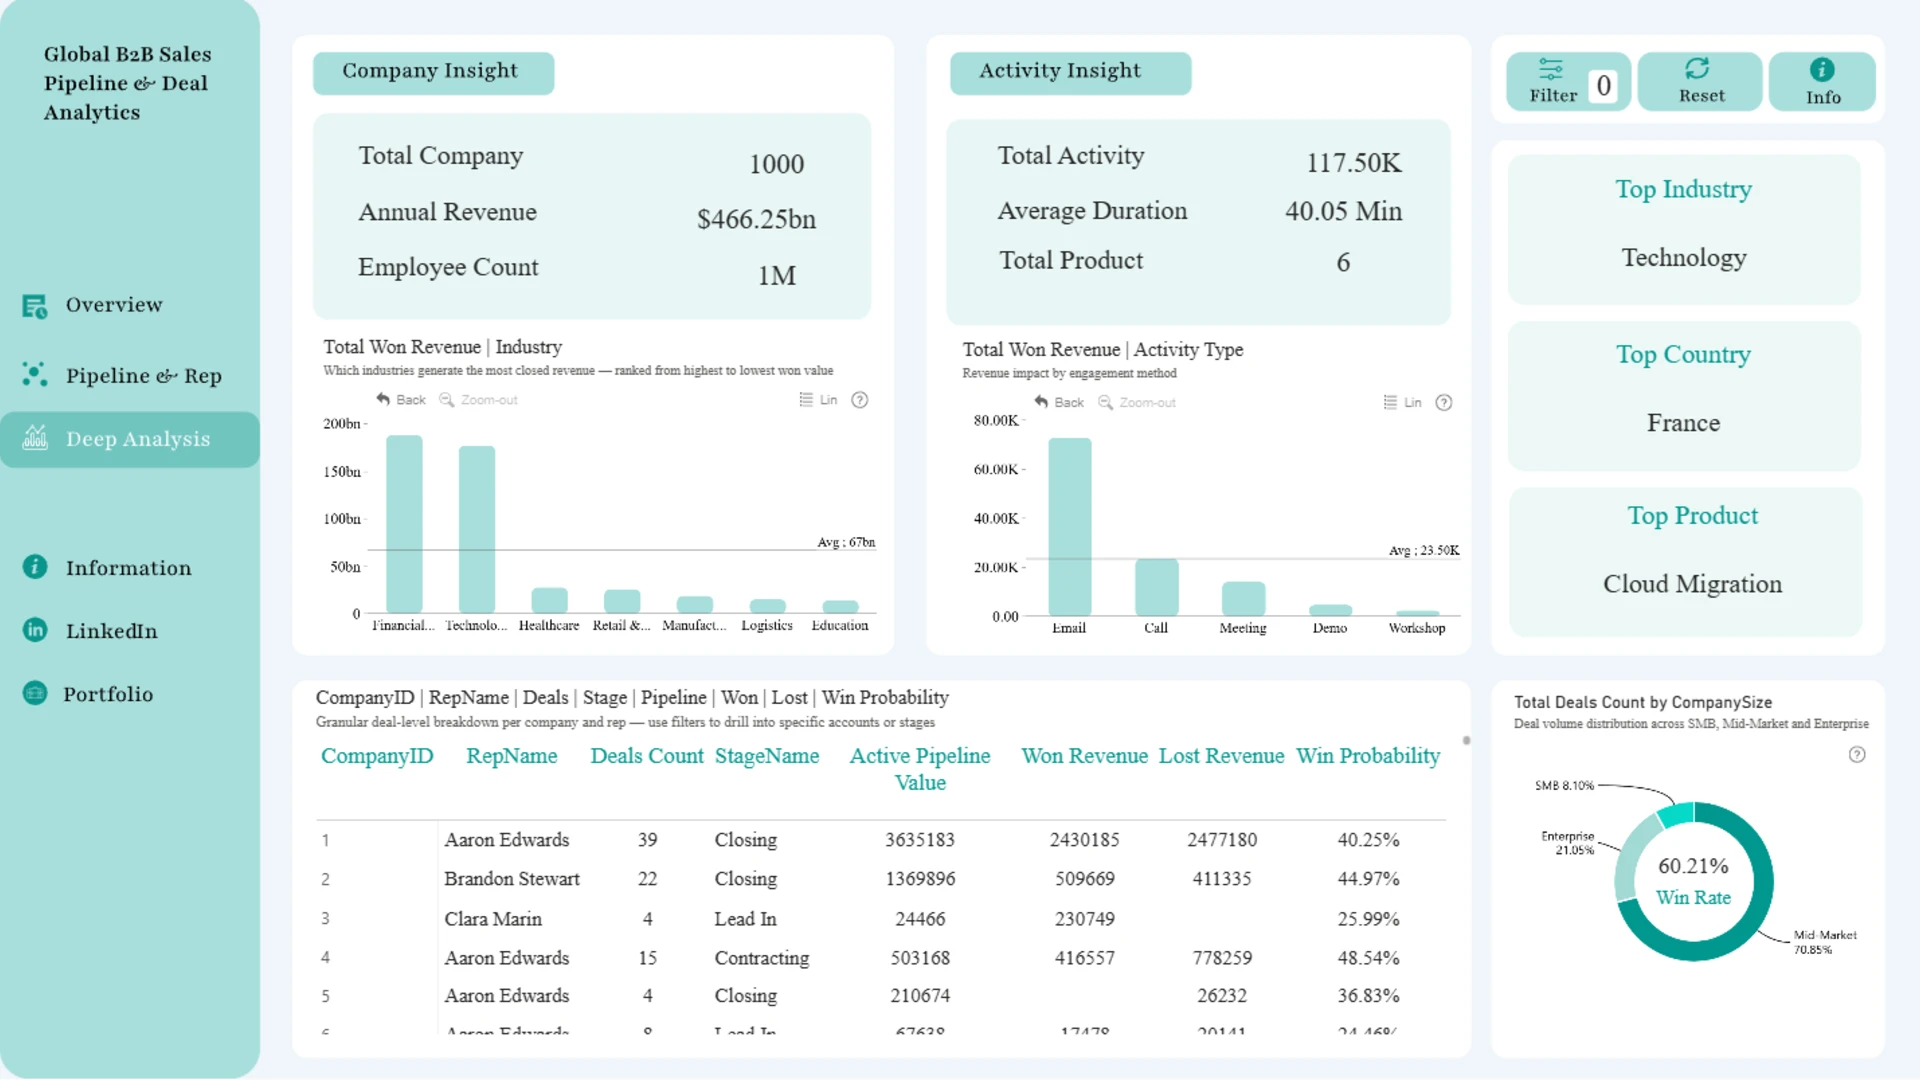
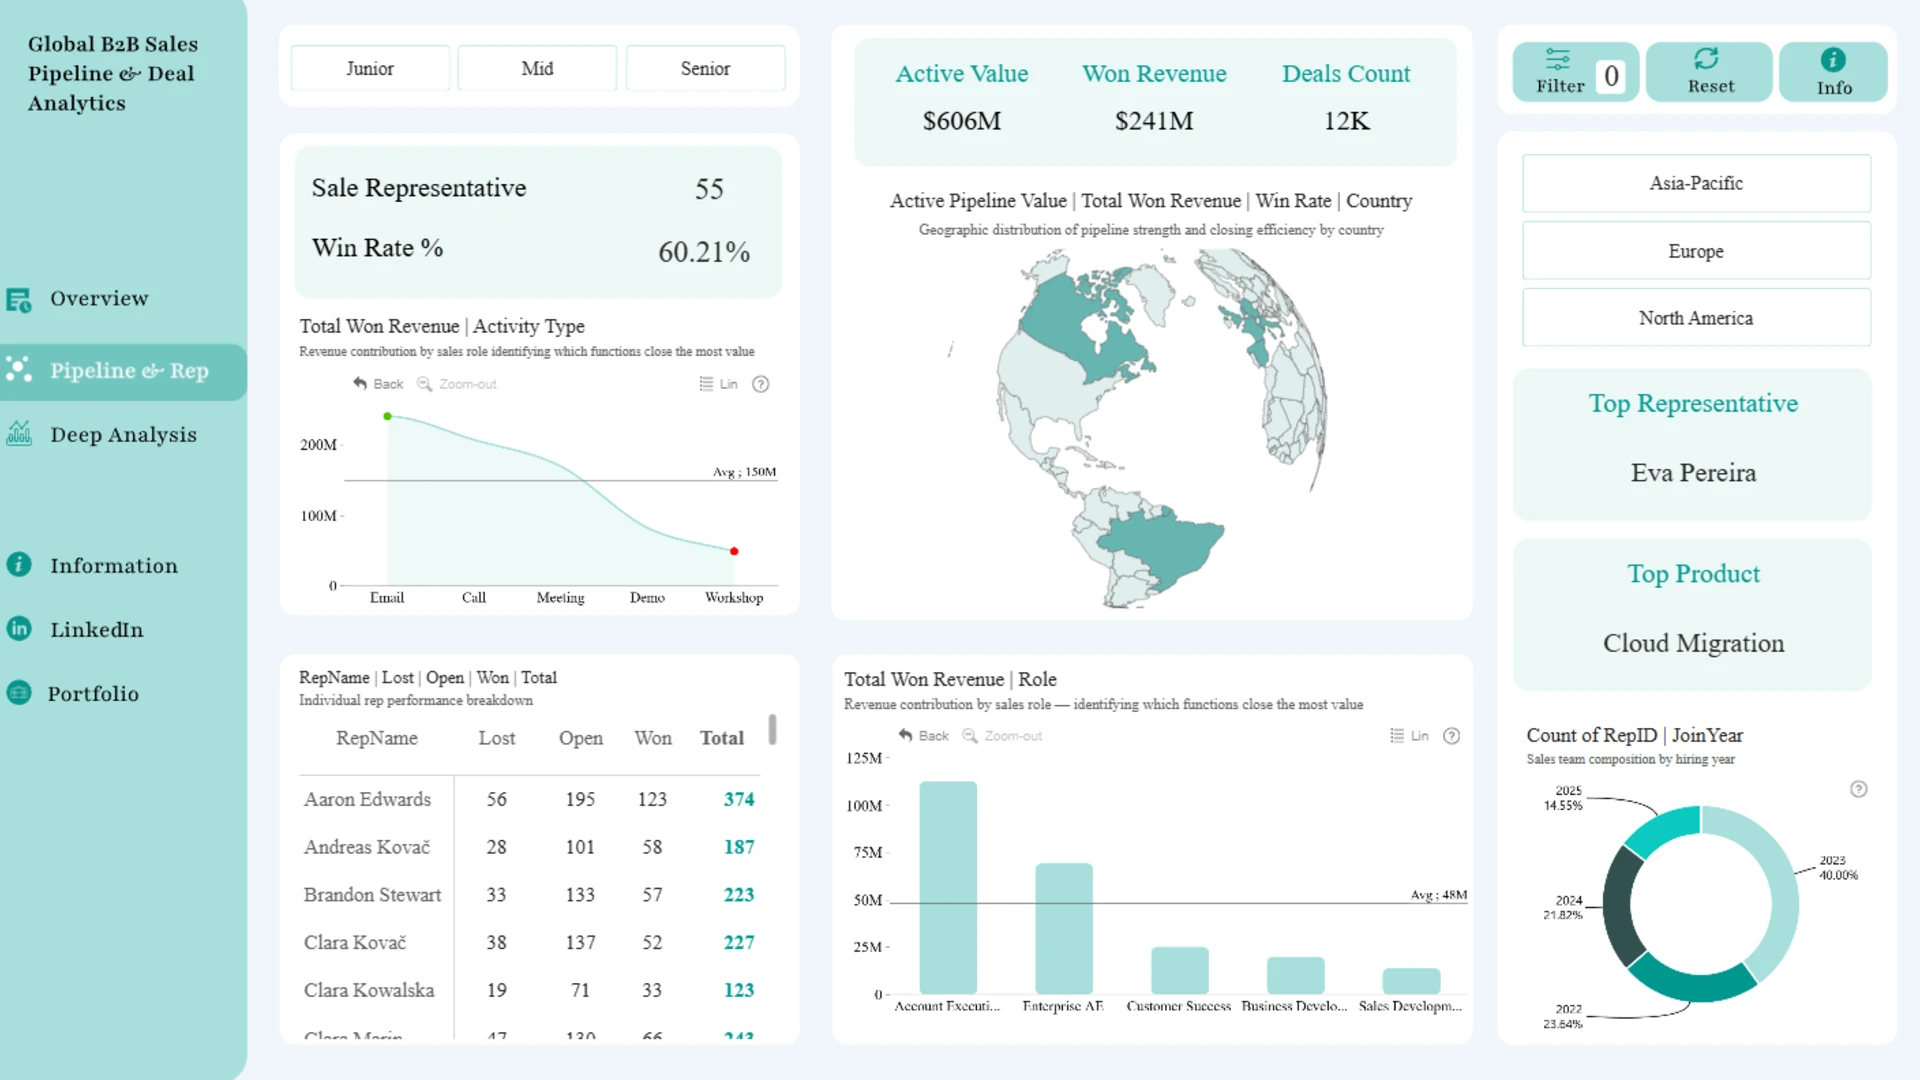
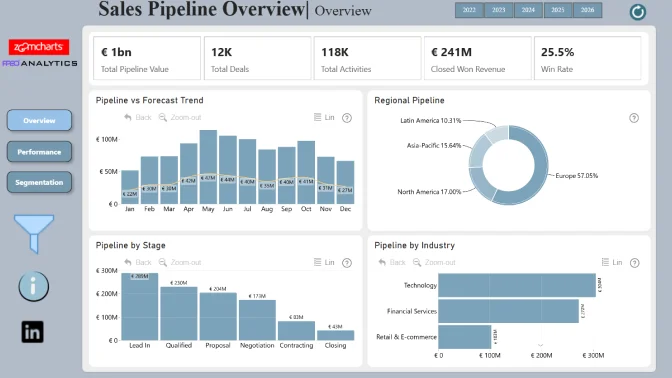
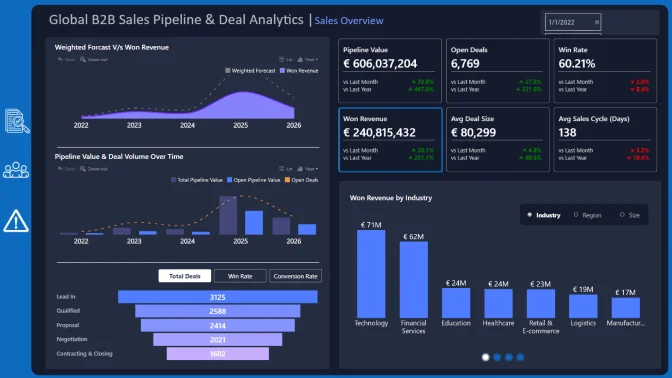
This Power BI sales pipeline dashboard template helps sales teams track active pipeline value, won revenue, deal count, win rate, sales activity, and representative performance. It provides an interactive view of pipeline health and deal progression across industries, regions, companies, and sales representatives.
The report was created by Aakash M using the Global B2B Sales Pipeline & Deals Analytics dataset. It was submitted to FP20 Analytics ZoomCharts Data Challenge 35, held in February–March 2026.
Key Insights of the Power BI Sales Pipeline Dashboard Template
The report brings together pipeline, revenue, activity, and sales-performance analysis. Its main insights include:
- Active pipeline value: monitor the current value and composition of open sales opportunities
- Won revenue: track revenue generated from successfully closed deals
- Deal count and win rate: compare sales volume with the share of opportunities converted into wins
- Deal progression: identify where opportunities are advancing, stalling, or creating the greatest revenue potential
- Sales representative performance: compare individual and company-level sales results
- Activity, industry, and regional trends: examine pipeline performance across key B2B sales dimensions
Drill Down Combo and Donut visuals provide multi-metric trend and category-composition views. Interactive filtering allows users to move from the overall pipeline to selected representatives, companies, industries, regions, activity types, or deal segments.
How to Use This Power BI Sales Pipeline Dashboard Template
Click an active chart series or donut segment to filter the related pipeline data. Compare revenue, deal counts, win rates, activities, and representative performance to identify areas that require closer attention.
Download the PBIX template to review the report structure, calculations, visual settings, and KPI logic in Power BI Desktop. Replace the sample connection with your own CRM data and adjust the stages, measures, territories, industries, and representative fields as needed.


4U Report Challenges
Participate in data challenges, build and submit reports to get free template downloads.
Join CommunityMobile view allows you to interact with the report. To Download the template please switch to desktop view.
How to use a PBIX template
Preview the interactive report, download the PBIX file, open it in Power BI Desktop, and replace the same data connection with your own dataset.
Preview and download
Explore the report online and download the PBIX template file.
Open in Power BI Desktop
Open the downloaded PBIX file in Power BI Desktop.
Connect your data
Replace the sample data source with your own dataset.
Refresh and adjust
Refresh the model and update fields or visual were needed.
Save and share
Save your report and publish it for your audience.


