25511
Sales Customer Profile Report
Sales Customer Profile Report
More Report pages
Report Author: ZoomCharts
25511
Share template with others
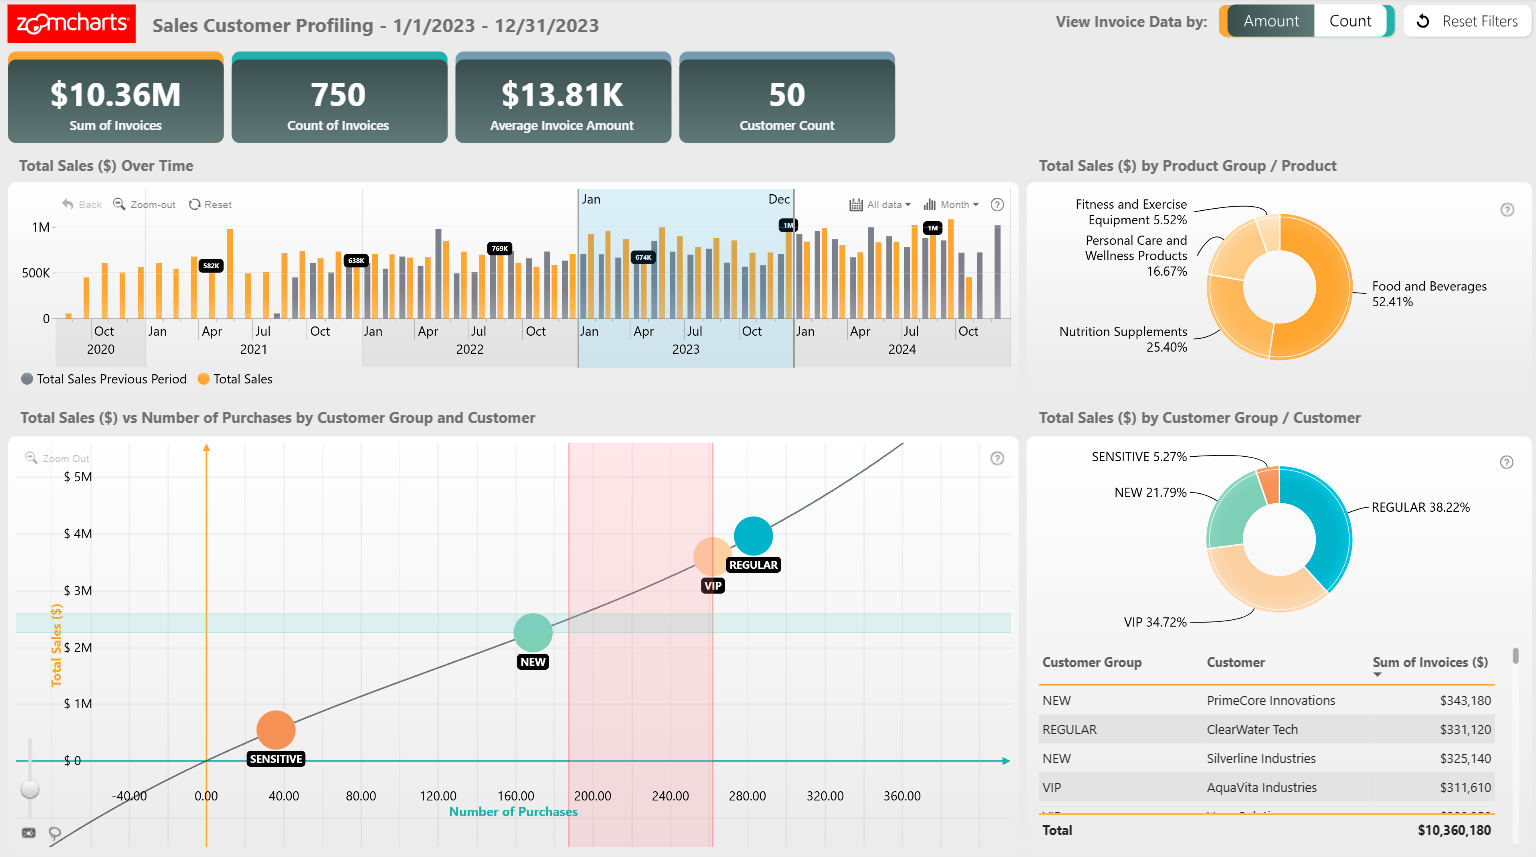
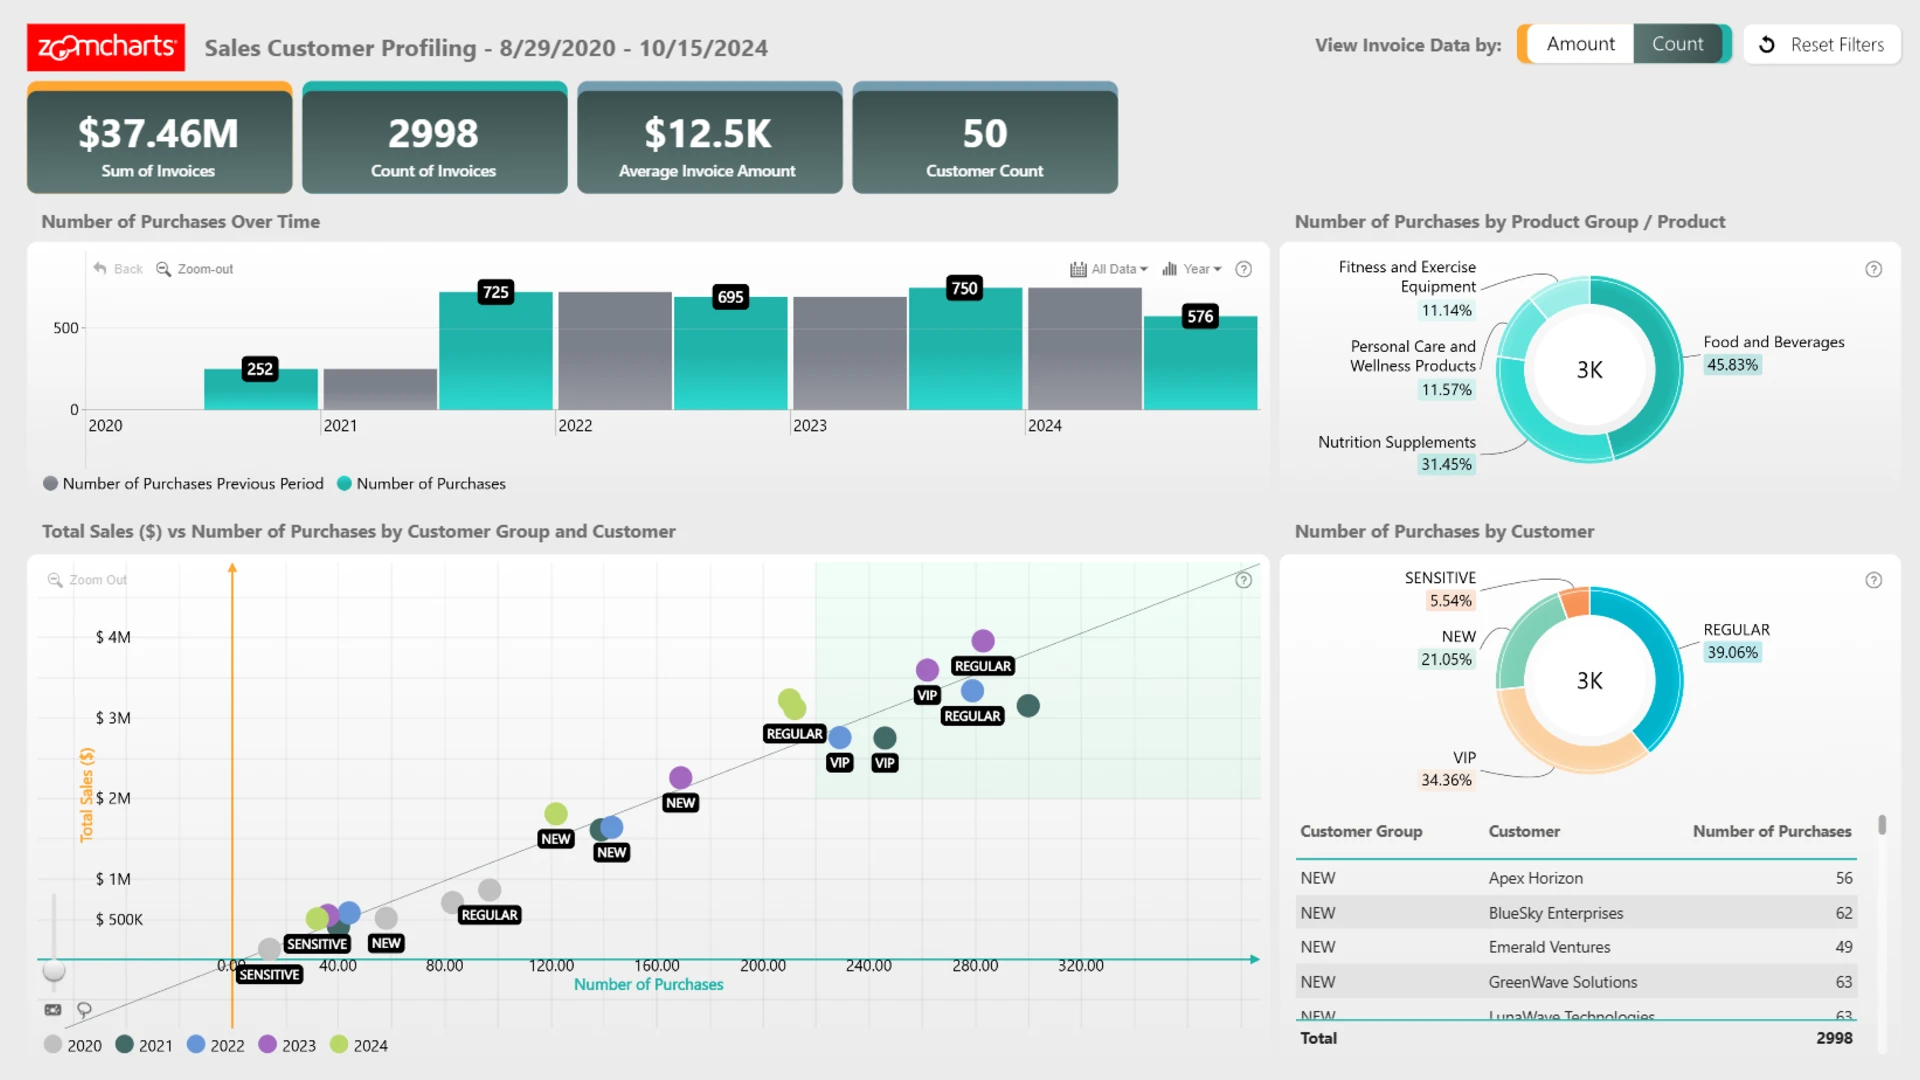
Sales Customer Profiling Report
Gain a deeper understanding of your customer base with this Sales Customer Profiling Report, powered by Scatter PRO, Donut PRO, and Timeline PRO. This interactive report provides a clear, at-a-glance overview of key sales insights, while the dynamic visuals allow you to drill down into the details of the dataset.
Key Insights of this Report
This report enables sales teams to analyze customer and product sales data across multiple dimensions, helping answer critical questions such as:
- Customer Distribution & Segmentation – Identify top-performing customer groups and key revenue contributors and analyze product performance to see which categories drive the most revenue.
- Customer Behavior & Trends – Identify seasonal trends, demand fluctuations, and long-term growth patterns.
- Sales Performance & Engagement – Analyze high-value customers, frequent buyers, and untapped opportunities for engagement.
Each metric dynamically cross-filters the others, allowing users to explore sales data from multiple perspectives. Filter by date, product category, customer group, region, or sales agent to uncover key insights, such as “Which customer segments generate the highest revenue?”, “Which products perform best across different seasons?”, and “Who are our most engaged and profitable customers?”
How to Use This Report
Interact with the report by clicking any active element in the ZoomCharts visuals. Download the file to explore settings, formulas, and calculations—or customize it with your own data.
Author:ZC
4U Report Challenges
Participate in data challenges, build and submit reports to get free template downloads.
Join CommunityMobile view allows you to interact with the report. To Download the template please switch to desktop view.


Was this helpful? Thank you for your feedback!
Sorry about that.
How can we improve it?