logo
For Power BI
  • Products
    • Custom Visuals for Power BI
    • Report Templates
  • Resources

      Resources

    • Documentation
    • Report Examples
    • Blog
    • Webinars
    • Video Tutorials
    • Visuals Gallery

    Support

    • ZoomCharts Assistance
    • Contact Sales
    • Contact Support
    • FAQ

    Challenges

    Challenges

    Improve your report creation skills by participating in free challenges for report creators.

    Learn more
    Get Developer License
  • Services
    • Power BI Report Development
    • Custom Visual Development
  • Challenges
  • Pricing
    • Custom Visuals for Power BI
    • Report Templates
Subscribe
Subscribe
Get it now
Go back

Contents

Contest logo
Contest logo
Contest logo
Contest logo
Try Free Now
Go back

FP20 Analytics July 2024 Challenge

Report Author: Tung Lam Ngo

184

Sales & CRM Pipelines Analysis

Report
Report Interact

Combo Bar Donut CRM Sales

Share template with others

Report submitted for FP20 Analytics ZoomCharts Challenge 17 (July 2024). The report was built with the CRM & Sales Pipeline Analysis dataset and includes ZoomCharts custom Drill Down PRO visuals for Power BI. 

Author's description:
Sales & CRM Pipelines Analysis Tung Lam Ngo
Key Insights: There are so many insights can be observed and discovered from the dataset and dashboard, but I will just cover a few!

Performance by Segment:
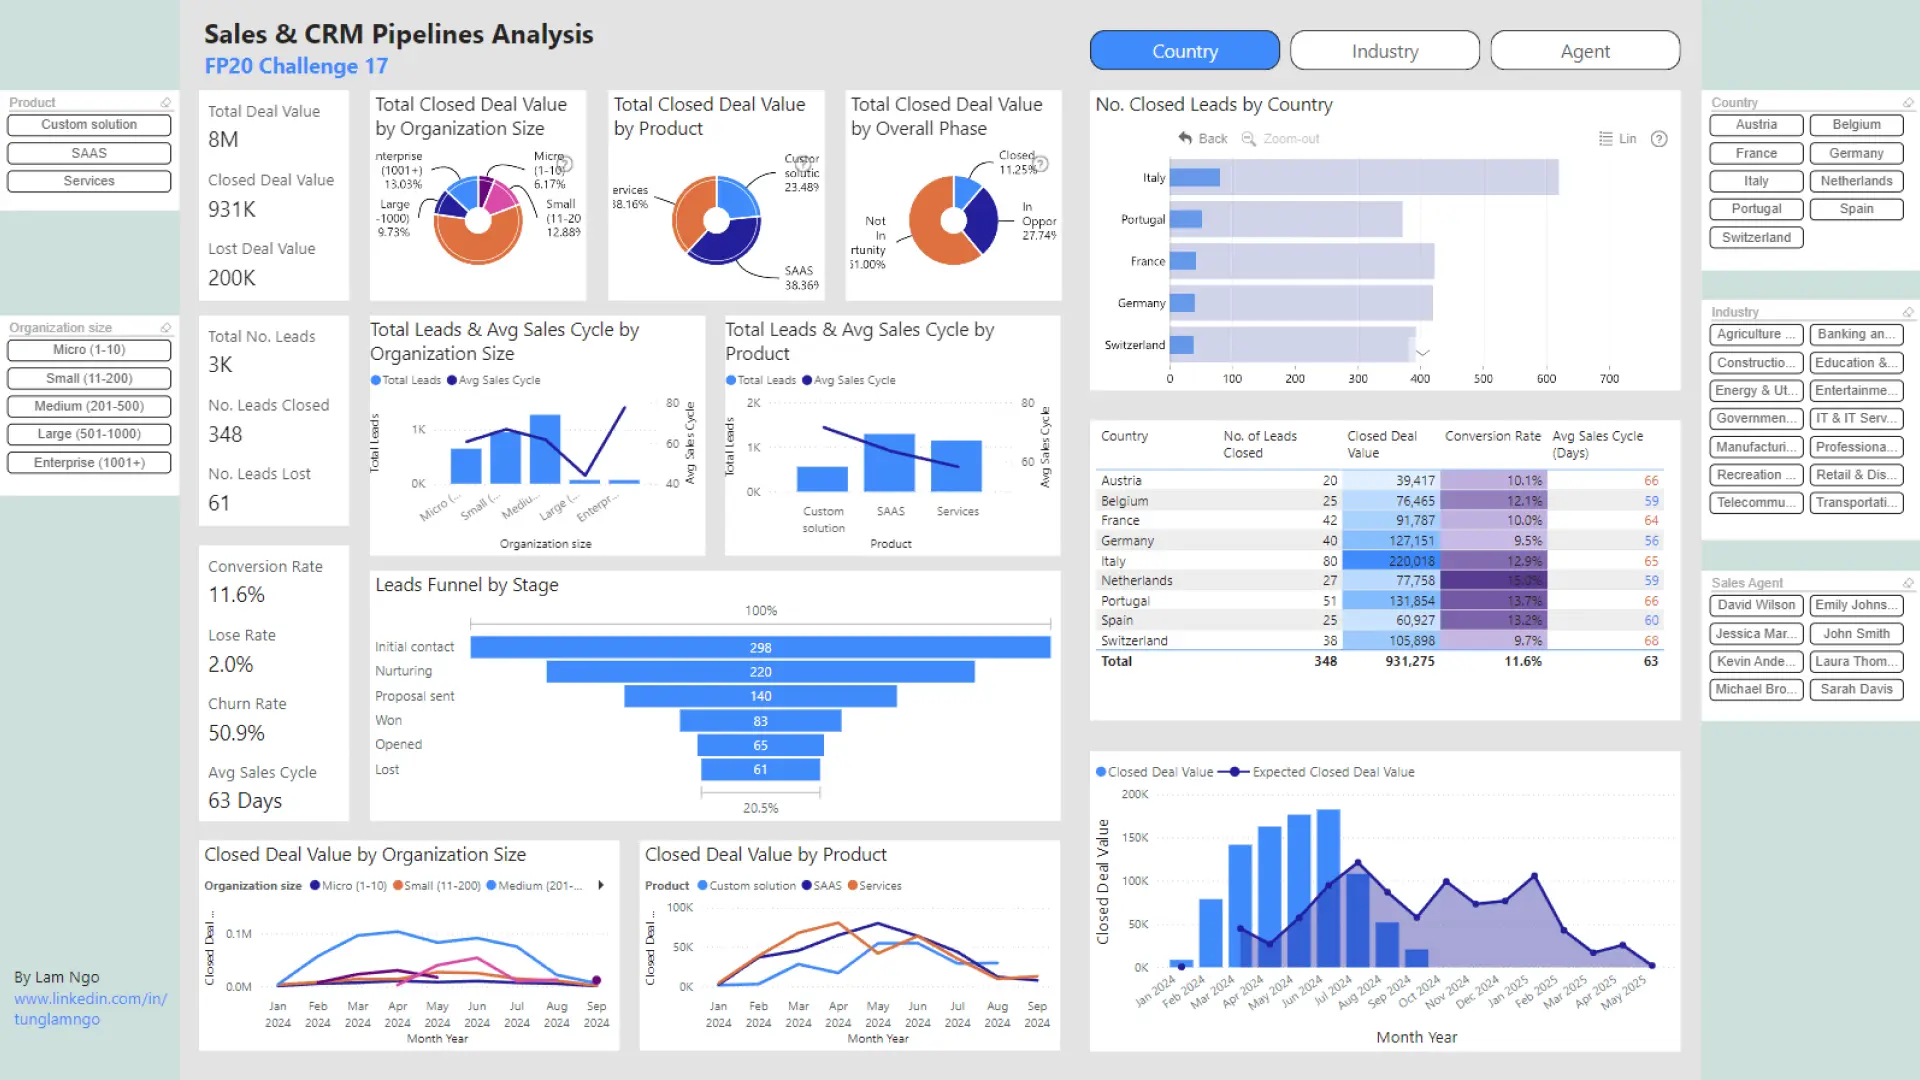
1. Organization Size: - Medium-sized organizations (201-500 employees) have the highest deal value, contributing over 58% of total closed deal value. - Micro organizations (1-10 employees), despite having around 10x more total leads compared to Large and Enterprise organizations, have the lowest total closed deal value. - Large organizations boast the quickest sales cycle at just 44 days, significantly faster than the second quickest at 60 days.
2. Product Performance: - SAAS products lead in both the number of leads and closed deal value, making them a significant revenue stream, with services coming in as a close second.
3. Sales Phases: - The leads funnel shows a gradual reduction in numbers through the stages, with notable drops from 'Proposal Sent' to 'Won' stages, indicating room for improvement in the closing phase.

Performance by Geography:
1. Country Performance: - Italy leads with the highest number of closed leads (80) and closed deal value ($220K), along with a strong conversion rate of 12.9%. - Switzerland has the highest average sales cycle duration (68 days) and the second lowest conversion rate, indicating longer negotiation times.

Performance by Sales Agent:
1. Top Performers: - Laura Thompson leads with 93 closed leads and a total closed deal value of $218K. She has a high conversion rate of 12.4% and an average sales cycle of 59 days, showcasing her efficiency and effectiveness. - Michael Brown and Jessica Martinez follow with 81 and 61 closed leads, respectively. Michael has a higher closed deal value ($177K) but a longer average sales cycle (71 days), suggesting more complex or high-value deals.

Performance by Industry:
1. Top Industries: - Transportation & Logistics and Banking and Finance lead in the number of closed leads (68 and 64 respectively) and closed deal values ($174K and $121K), with strong conversion rates (12.9% and 12.6%). - Education & Science and Recreation & Sports have the shortest average sales cycles, both under 50 days, indicating efficient sales processes in these industries.

These insights highlight the strengths and areas for improvement across different segments, helping to drive strategic decisions and optimize sales performance. Last but not least, thank you so much for organizing this challenge!

ZoomCharts visuals used

Drill Down Combo Bar PRO Drill Down Combo Bar PRO
Drill Down Donut PRO Drill Down Donut PRO

Need help?

Send your question to ZoomCharts assistant, and we will respond to you as soon as possible.

Contact Us

Mobile view allows you to interact with the report. To Download the template please switch to desktop view.

Report Overhaul

ZoomCharts Academy

Learn ZoomCharts with experts and become certified!

Go to Academy!
Report Overhaul

Was this helpful? Thank you for your feedback!

Sorry about that.

How can we improve it?

Sales & CRM Pipelines Analysis

Share

ZoomCharts

Welcome to ZoomCharts

You’re almost there! Create an account to keep your saved reports.

or
Sign up with Microsoft

Verify your email address

We have sent a code to your email address. Please input the code below.

Didn't receive code? Request again (after 30 seconds)

Already have an account? Log in

ZoomCharts

Log in to your ZoomCharts account

Log in with Microsoft
or
Forgot password?

Reset your password

We'll email you instructions on how to reset your password

Don't have an account? Sign up

Please add credits

You have 0 available downloads.
Get more credits or upgrade your plan to continue.

View pricing
logo
[email protected]
+44 204 577 3993
logo

Products

Drill Down Network PRO Drill Down Waterfall PRO Drill Down Graph PRO Drill Down Combo PRO Drill Down Combo Bar PRO Drill Down Donut PRO Drill Down Pie PRO Drill Down TimeSeries PRO Drill Down Timeline PRO Drill Down Map PRO Drill Down Scatter PRO All Visuals

Resources

Report Examples Webinars Blog ZoomCharts Academy Visuals Gallery Documentation Custom Visual Development Subscribe to News

Solutions

Custom Visual Development

Company

Pricing About Us Partners Leave feedback Join PowerGroup EU Funding

Help

ZoomCharts Assistance Contact Sales Contact Support FAQ

Drill Down Network PRO Drill Down Waterfall PRO Drill Down Graph PRO Drill Down Combo PRO Drill Down Combo Bar PRO Drill Down Donut PRO Drill Down Pie PRO Drill Down TimeSeries PRO Drill Down Timeline PRO Drill Down Map PRO Drill Down Scatter PRO All Visuals

Report Examples Webinars Blog ZoomCharts Academy Visuals Gallery Documentation Custom Visual Development Subscribe to News

Custom Visual Development

Pricing About Us Partners Leave feedback Join PowerGroup EU Funding

ZoomCharts Assistance Contact Sales Contact Support FAQ
+44 204 577 3993
[email protected]

Ready to get in touch?

Contact our experts with any question about Power BI and ZoomCharts for Free!

Contact us

© 2025, Data Visualization Software Lab

U.S. Patents No. 11,645,343; 11,921,804; 12,346,389

Cookies
Privacy Policy
Global
Legal
Patent
warning

Error message

success

Success info: Done!

ZoomCharts AI Assistant

We noticed you're using an old OS version.

For the best experience, we recommend upgrading to ensure that all website features display correctly.

Cookie settings

We use necessary cookies for site functionality, as well as statistic, marketing, and preference cookies to enhance your experience. For more information and to manage your preferences, please visit our Cookie policy