61713
Retail Supply Chain and Sales Analysis by Sushree Jena
Retail Supply Chain and Sales Analysis by Sushree Jena
More Report pages
Overhauled by ZoomCharts
61713
Share template with others
Summary
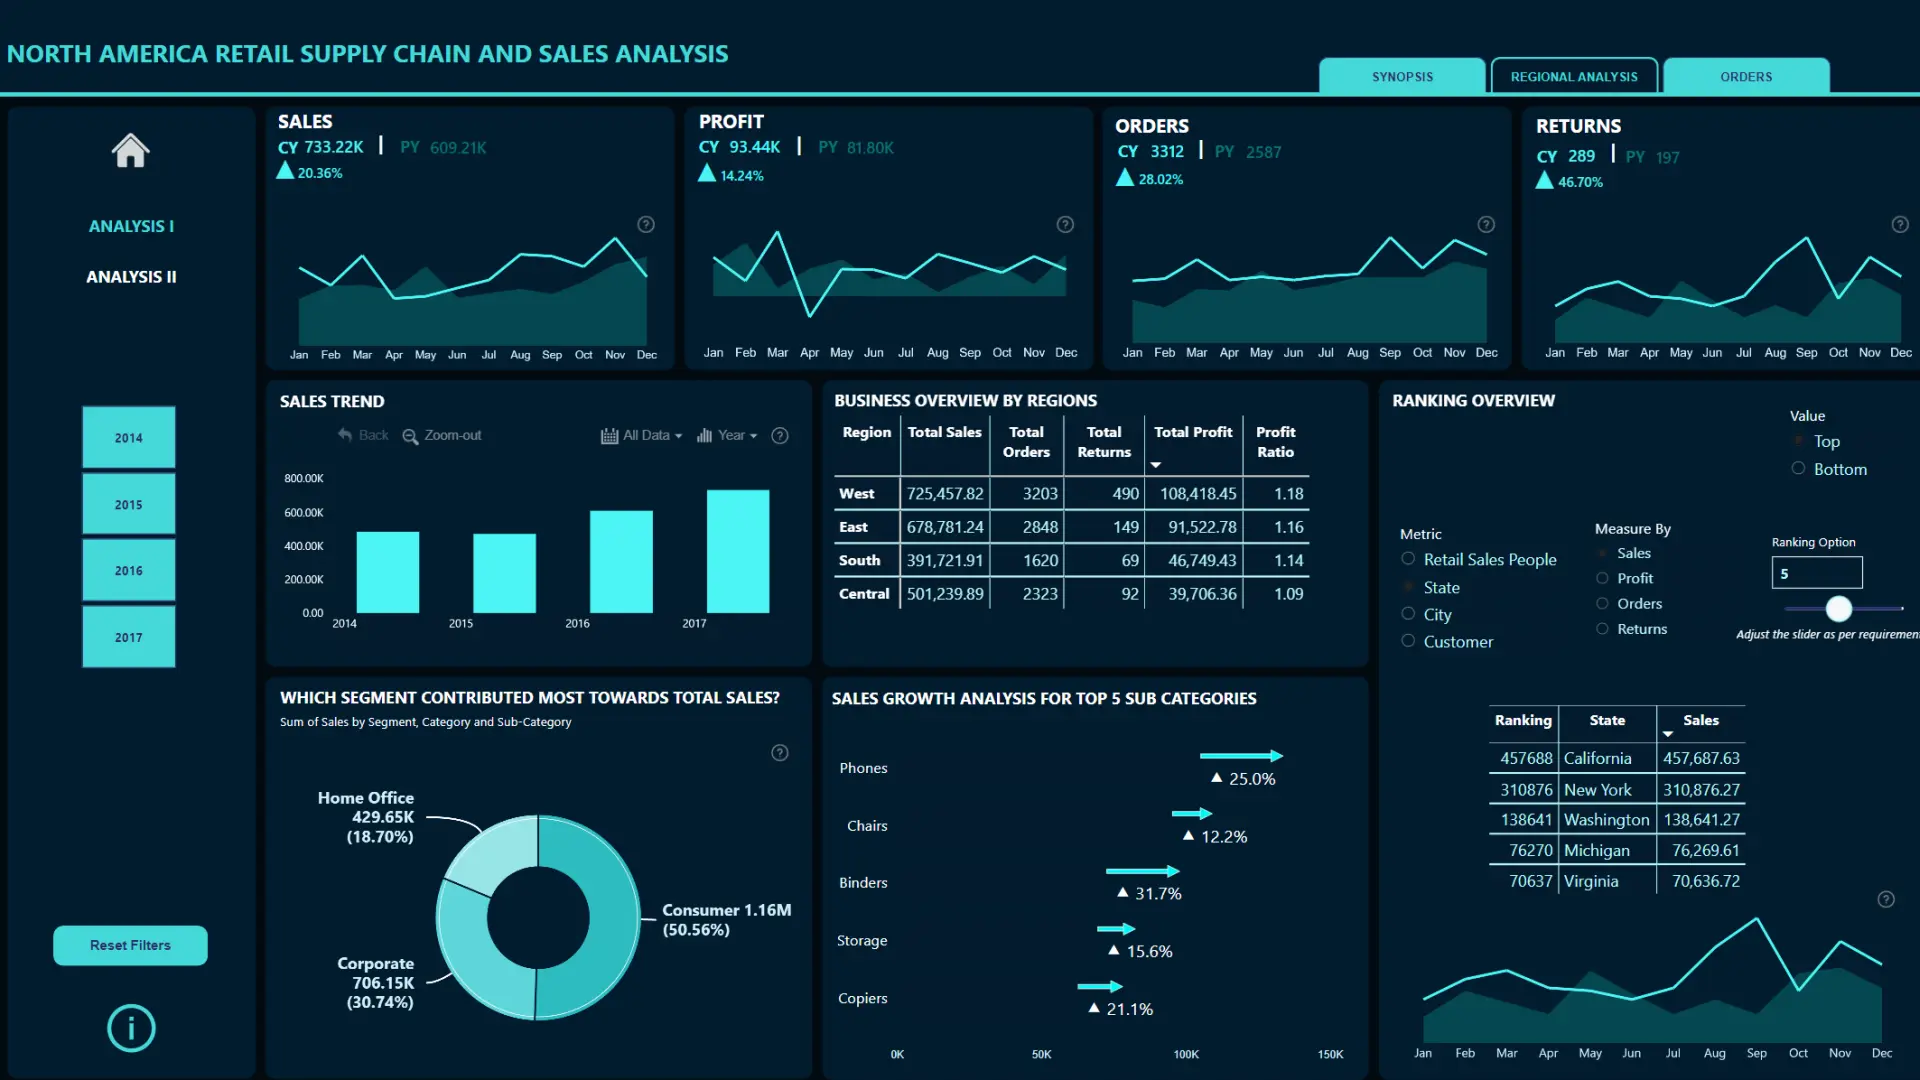
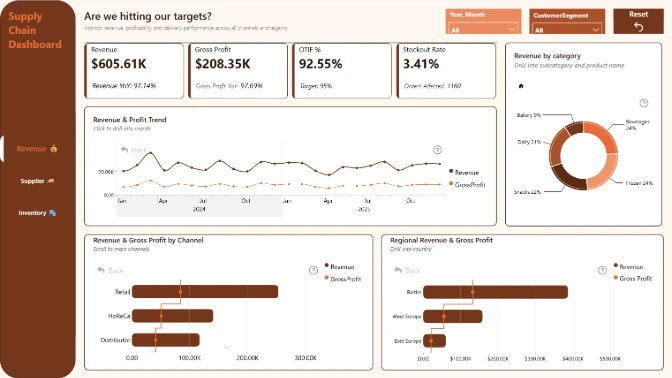
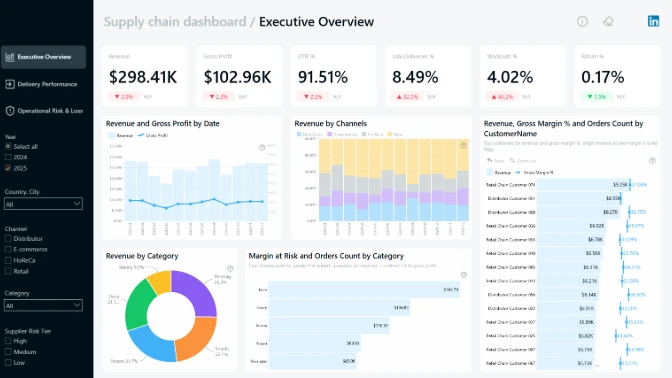
This Power BI dashboard for supply chain and sales analysis is the winning entry for the FP20 Analytics October 2023 ZoomCharts Challenge. The contestant visualized a challenge dataset of sales data for a North American retail network.
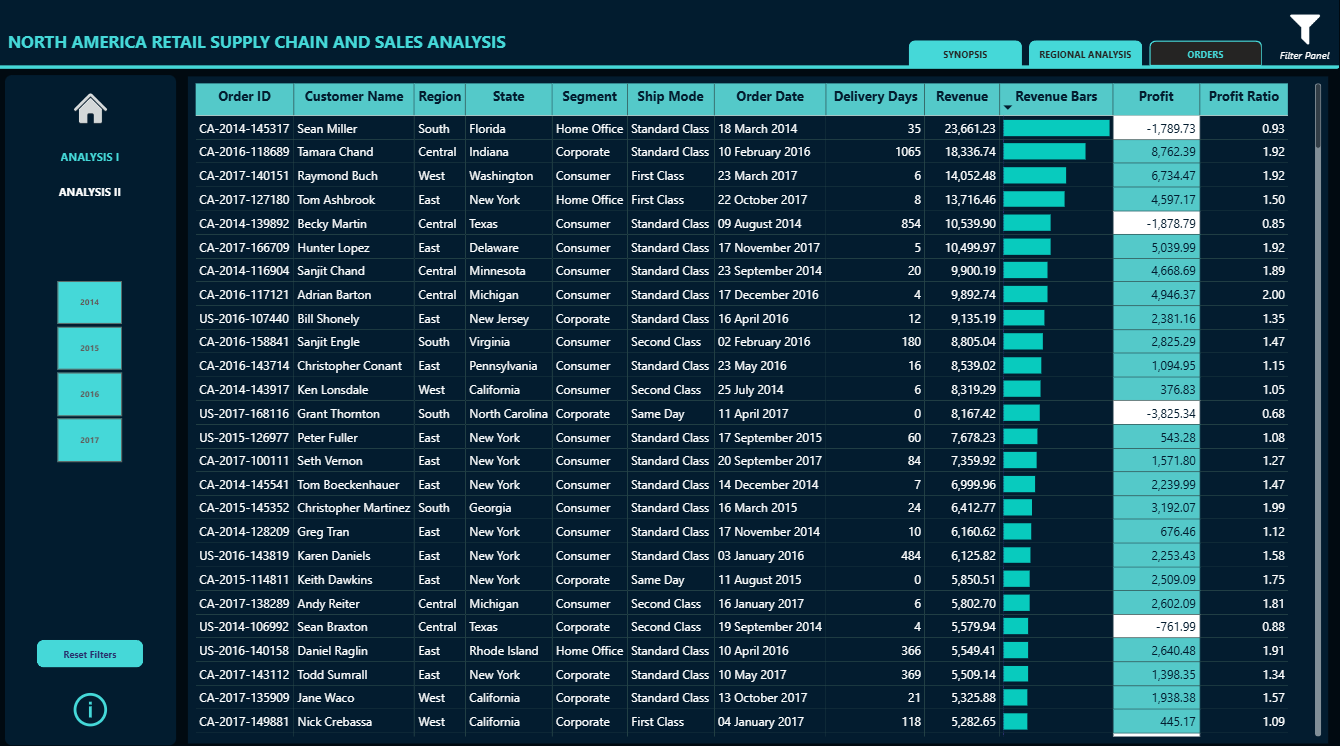
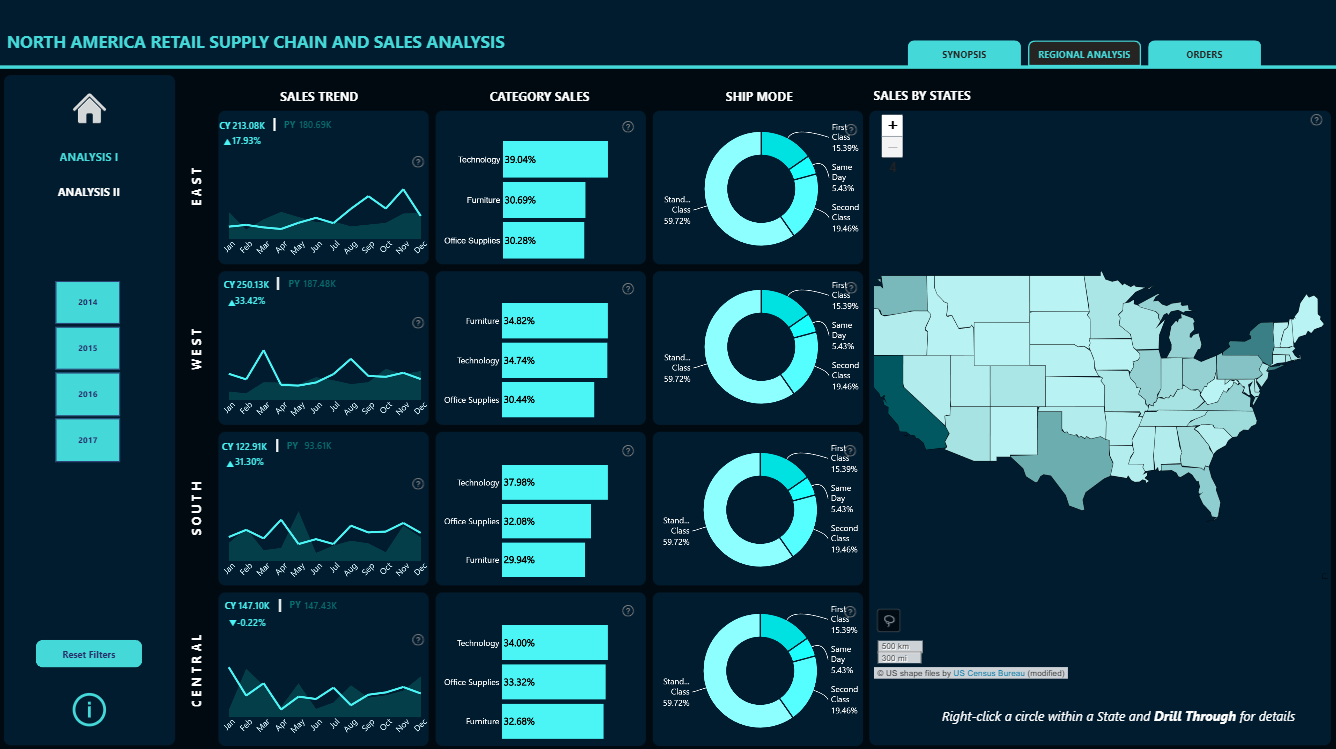
ZoomCharts noted the consistent color scheme coupled with a thoughtful use and placement of visuals and slicers. The first report page shows an all-encompassing overview that allows the user to filter and drill down for deeper insights and access more data with tabs, and the second page displays a focused look at the correlation between specific metrics.
This Power BI supply chain example report is based on the challenge submission with minor refinements by the ZoomCharts team. See the original submission here.
How To Use This Report Template
To interact with this Power BI report, simply click any active elements directly on the charts.
Download this report to see all the settings, formulas, and calculations. Try it out with your own data by making a few adjustments.
4U Report Challenges
Participate in data challenges, build and submit reports to get free template downloads.
Join CommunityMobile view allows you to interact with the report. To Download the template please switch to desktop view.
Was this helpful? Thank you for your feedback!
Sorry about that.
How can we improve it?