1717
Power BI Renewal Prioritization Dashboard Example
Power BI Renewal Prioritization Dashboard Example
More Report pages
Report Author: ZoomCharts
1717
Share template with others
Power BI Renewal Prioritization Dashboard
A Power BI dashboard example for monitoring upcoming contract renewals, identifying at-risk deals, and prioritizing revenue retention actions.
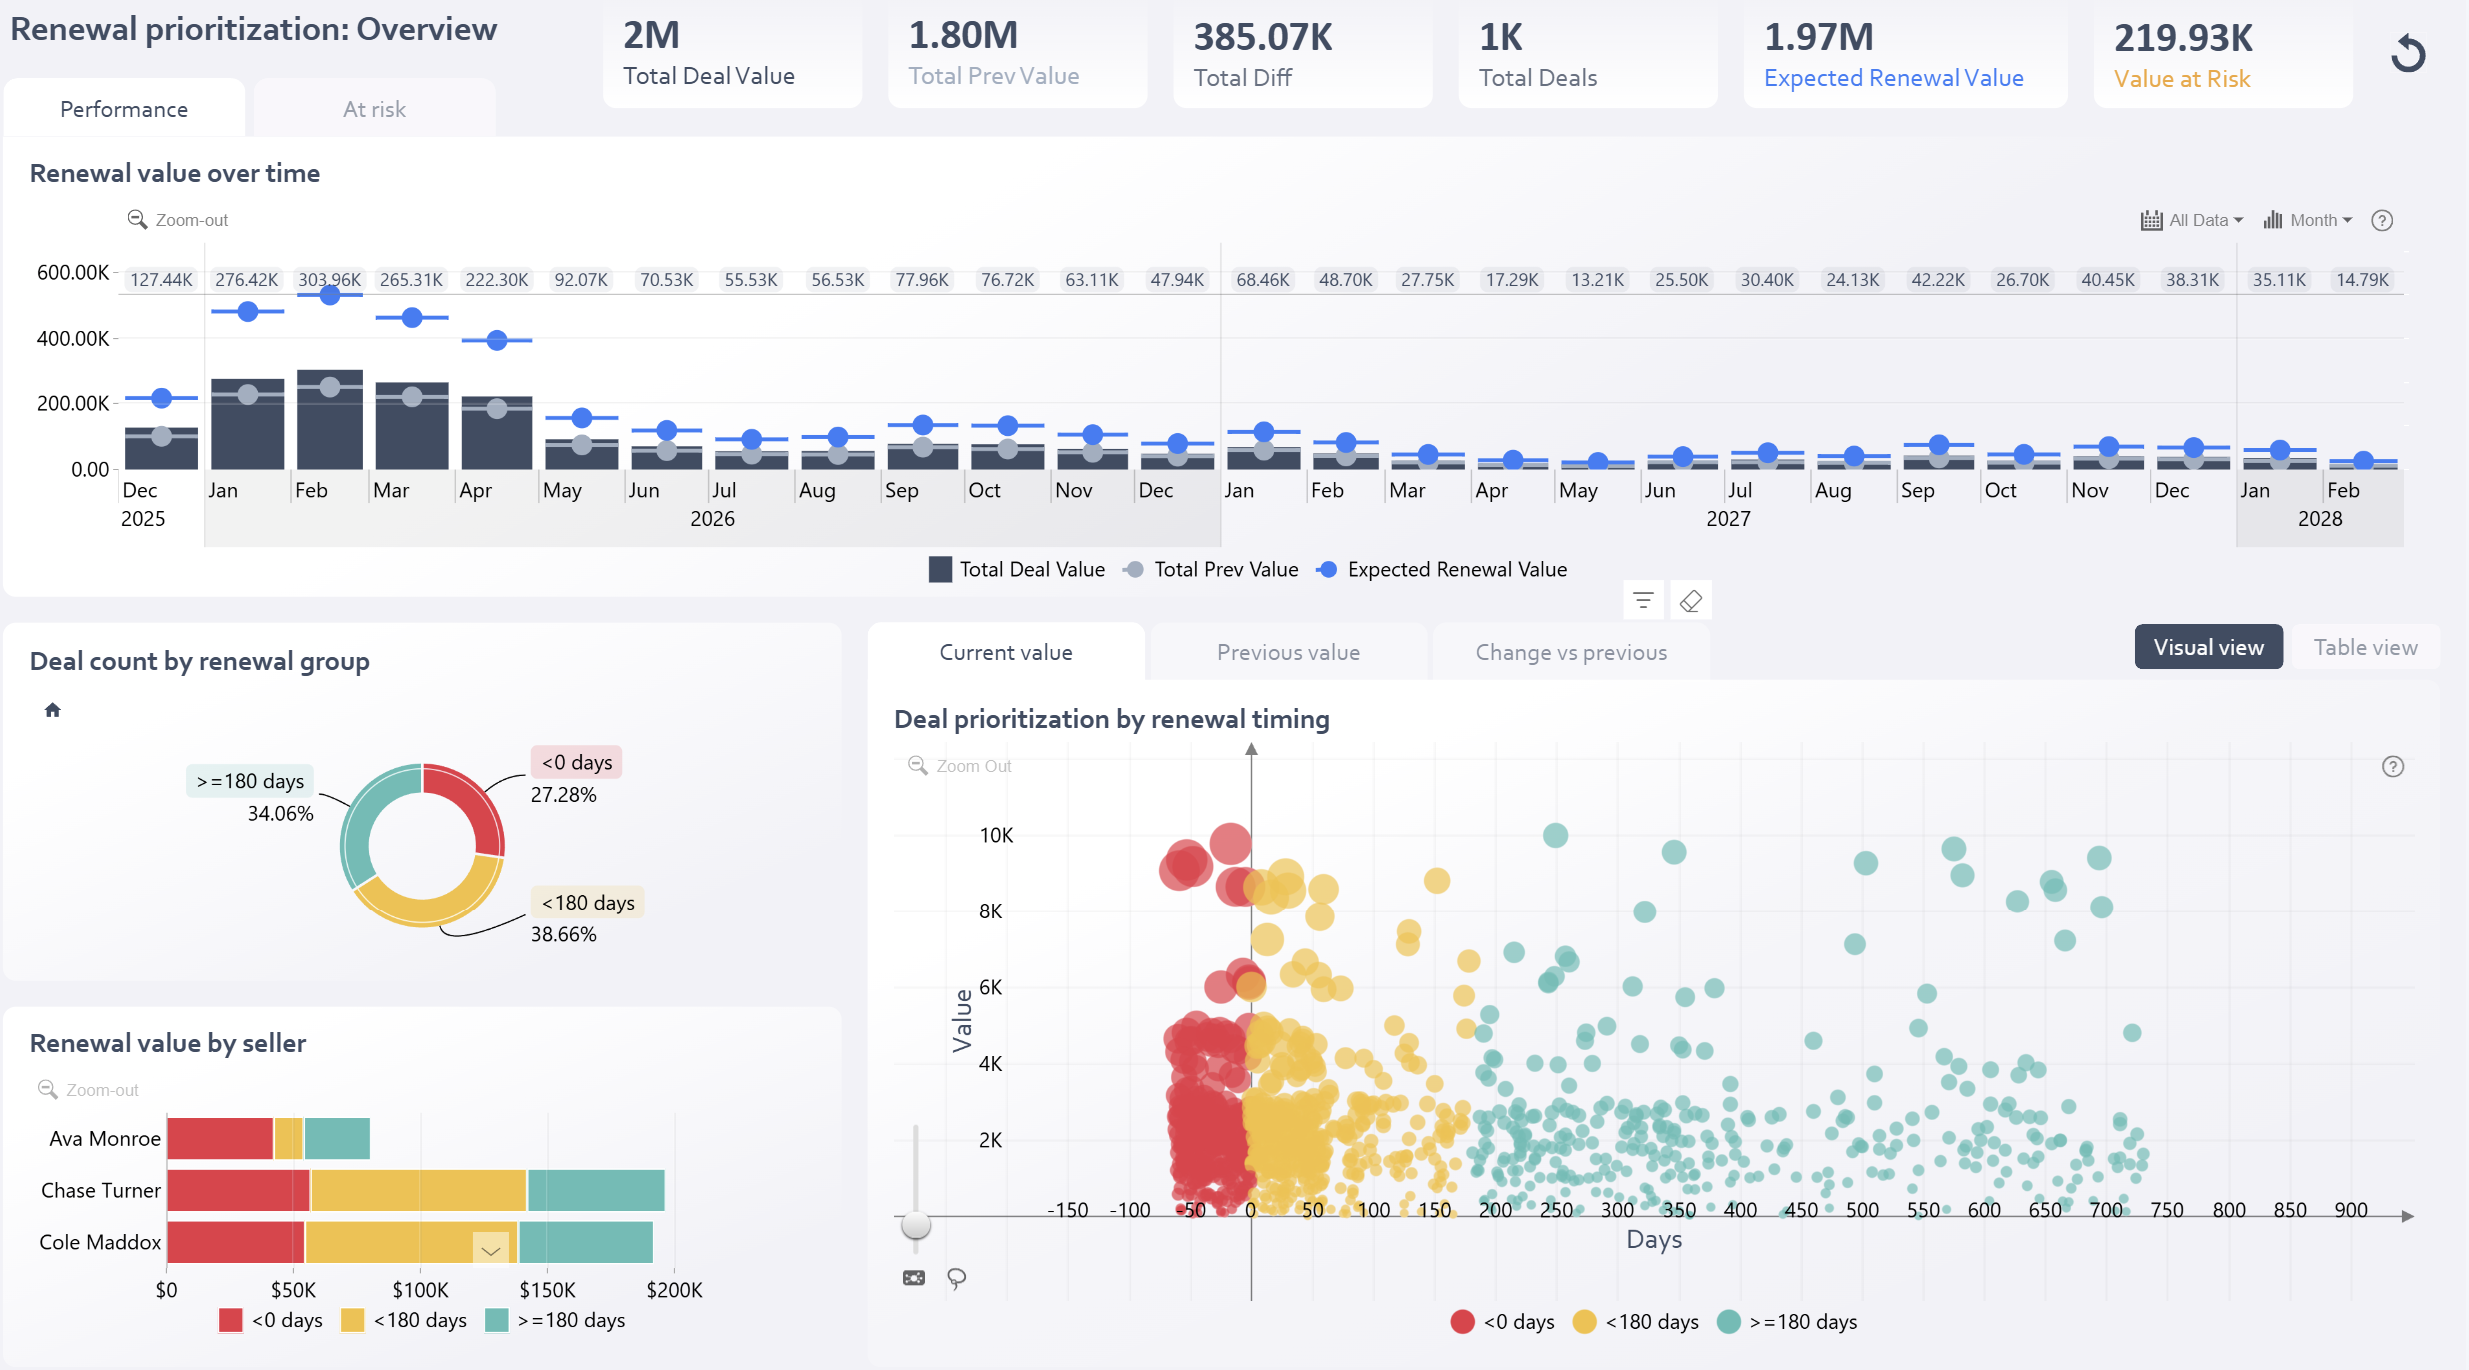
This Renewal Prioritization dashboard Power BI example helps sales, customer success, and revenue operations teams monitor upcoming contract renewals, identify at-risk opportunities, and focus on the deals that require immediate attention.
The report provides a comprehensive overview of renewal performance and risk by tracking total renewal value, expected renewal value, deal volume, and value at risk. Interactive visualizations help users understand how renewal opportunities are distributed across urgency groups, sellers, and renewal timelines.
Key Insights of This Power BI Renewal Prioritization Dashboard
Renewal Performance Overview
Track total renewal value, expected renewal value, deal count, and value at risk.
Renewal Trends
Monitor renewal value trends over time for planning, forecasting, and performance review.
Urgency Segmentation
Group opportunities into overdue renewals, upcoming renewals, and future renewals.
Seller Performance
Compare renewal ownership and seller performance by renewal category and priority group.
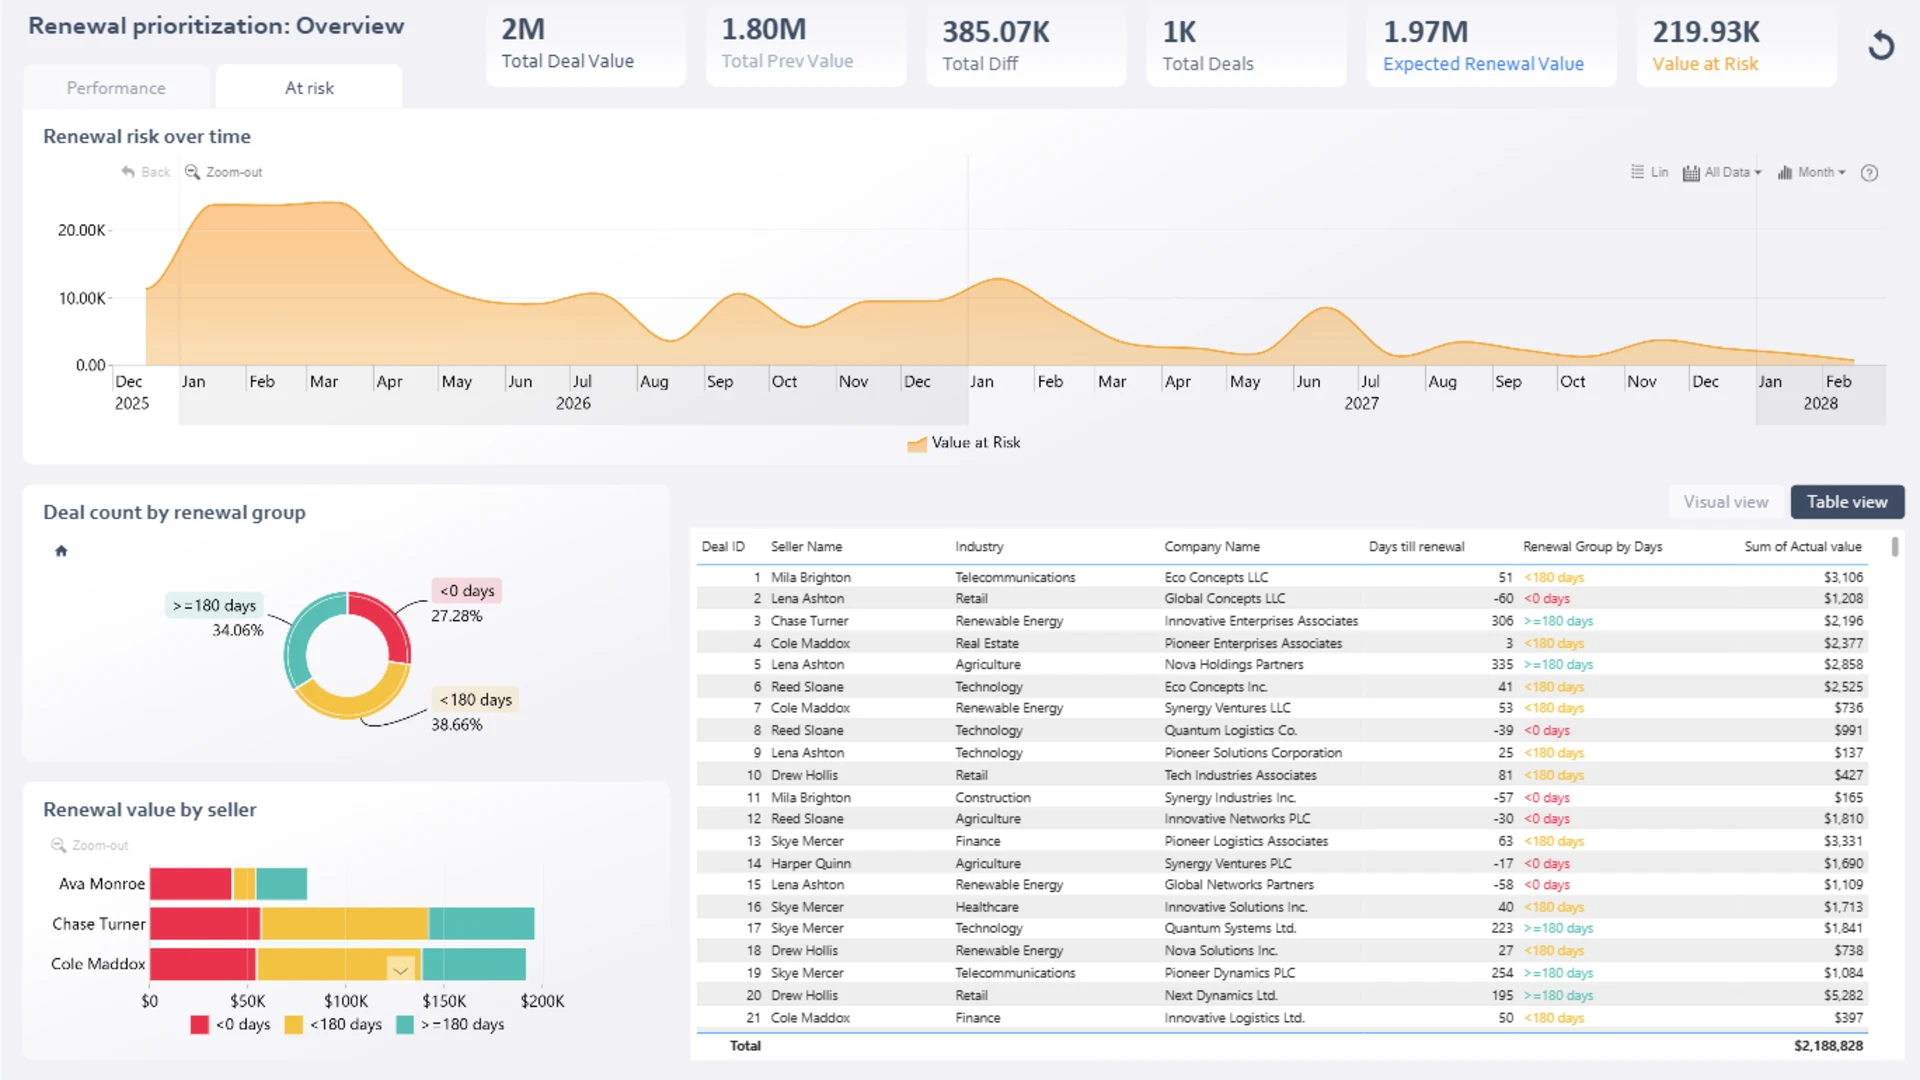
Deal-Level Prioritization
Identify high-value, high-risk accounts that require immediate follow-up.
Pipeline Health Monitoring
Understand renewal exposure and maintain a healthier revenue pipeline.
Standout Feature
The interactive Deal Prioritization Bubble Chart plots renewal value against days until renewal. Combined with color-coded urgency groups, it helps users quickly spot the opportunities with the greatest potential impact on revenue retention.
Renewal Pipeline Segments
Overdue Renewals
Renewals with less than 0 days remaining.
Upcoming Renewals
Renewals due within 180 days.
Future Renewals
Renewals due in 180 days or more.
How to Use This Power BI Renewal Prioritization Dashboard
Click to explore
Select any active chart element to filter and cross-highlight related renewal data.
Prioritize follow-up
Filter by urgency group, seller, renewal timeline, or deal value to focus on the most important accounts.
Switch views
Use the Visual & Table View toggle to move between graphical analysis and detailed deal-level information.
Download and Customize
Download the .pbix file to explore the report structure, calculations, and measures. You can adapt this template to your own renewal management process and data model with minimal modifications.
ZoomCharts visuals used
4U Report Challenges
Participate in data challenges, build and submit reports to get free template downloads.
Join CommunityMobile view allows you to interact with the report. To Download the template please switch to desktop view.


Was this helpful? Thank you for your feedback!
Sorry about that.
How can we improve it?