This interactive Power BI report explores the European Real Estate Market Analytics dataset using ZoomCharts Drill Down custom visuals for Power BI. It highlights property prices, price per square meter, listing activity, and property characteristics across countries and cities, helping users identify market trends, compare locations, and evaluate investment opportunities.
The report was submitted to the FP20 Analytics ZoomCharts Data Challenge #36 (March – April 2026).
Author’s Description:
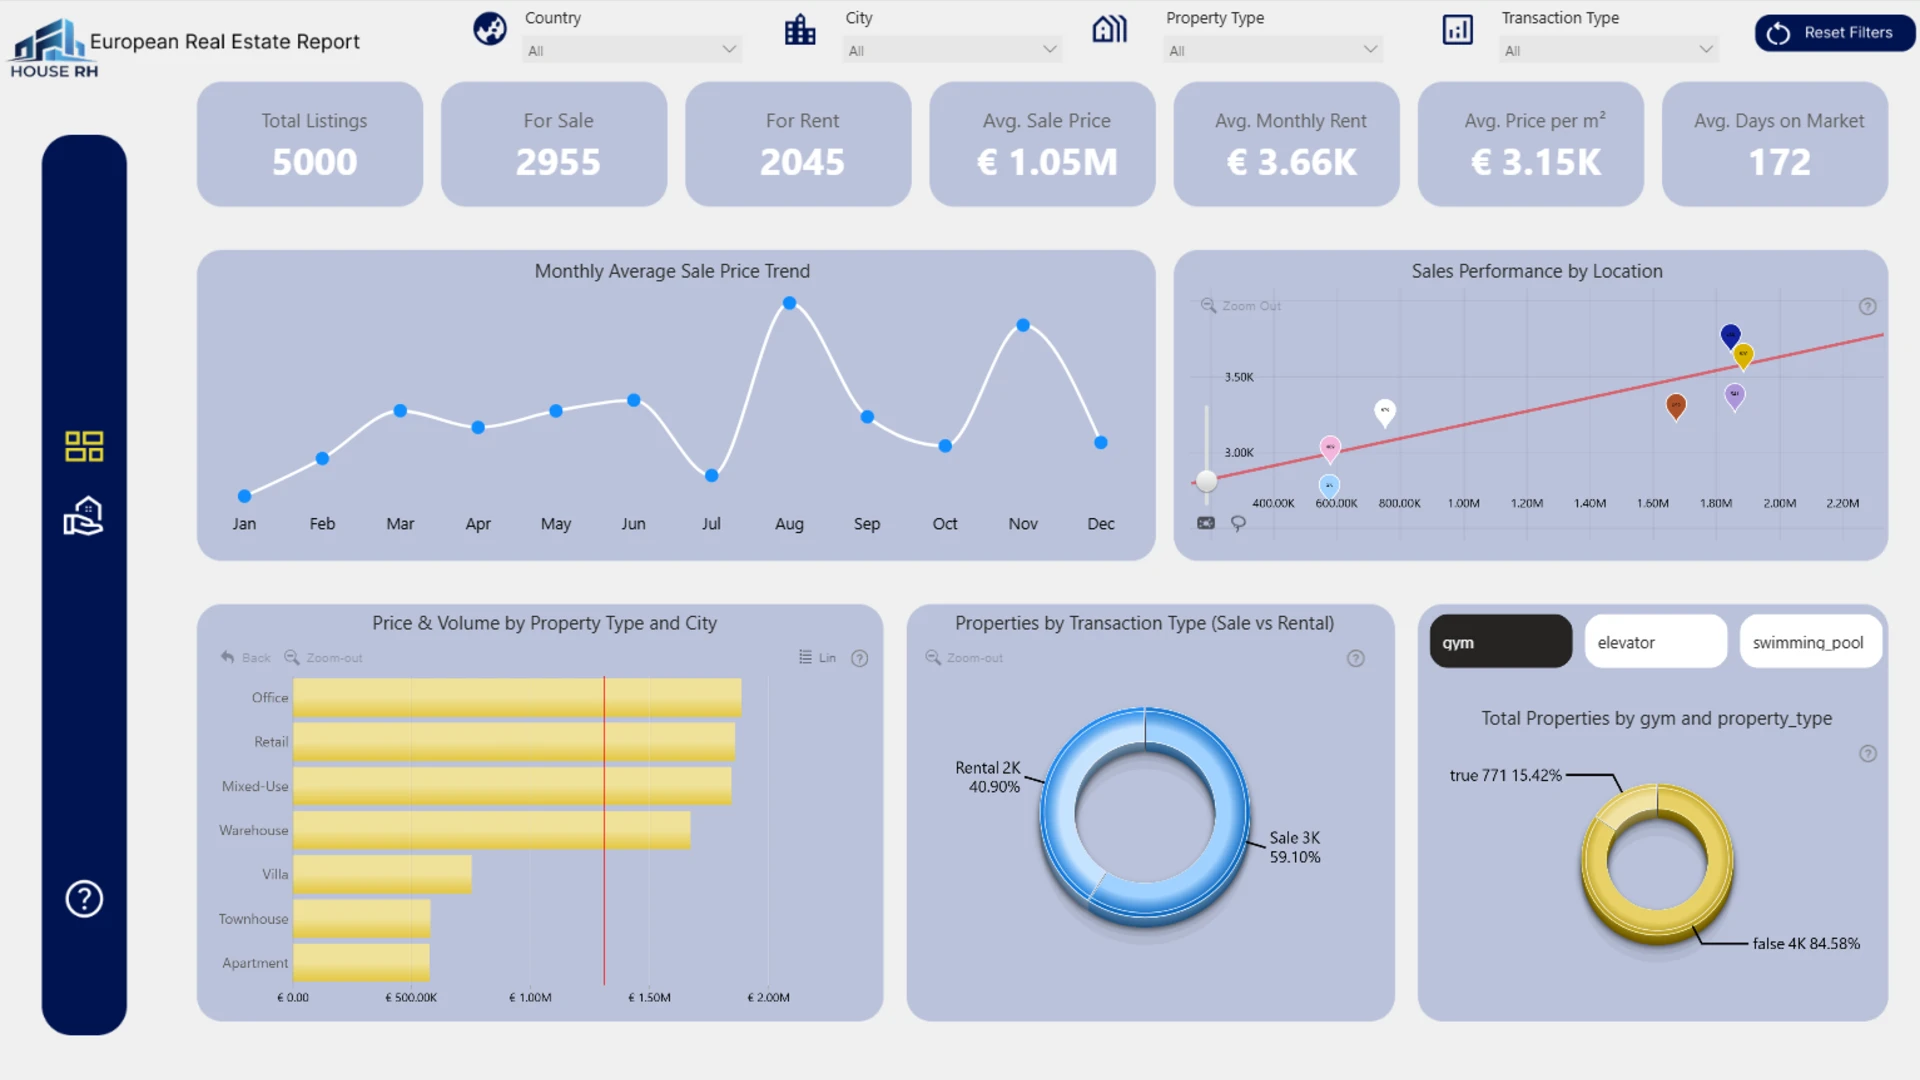
This European real estate dashboard provides a clear, data-driven overview of the market, covering 5,000 listings with insights into pricing, rental distribution, and average time on market.
It highlights key trends such as seasonal price fluctuations, differences by property type and city, and the impact of property age across countries. Overall, the analysis reveals a mature market where Northern regions command premium prices, while Southern and Eastern areas offer more affordable entry points, with longer listing durations indicating opportunities to improve market liquidity.