475
Property Value & Market Activity Dashboard 3
Property Value & Market Activity Dashboard 3
Report Author: Su Thinzar Oo
475
Share template with others
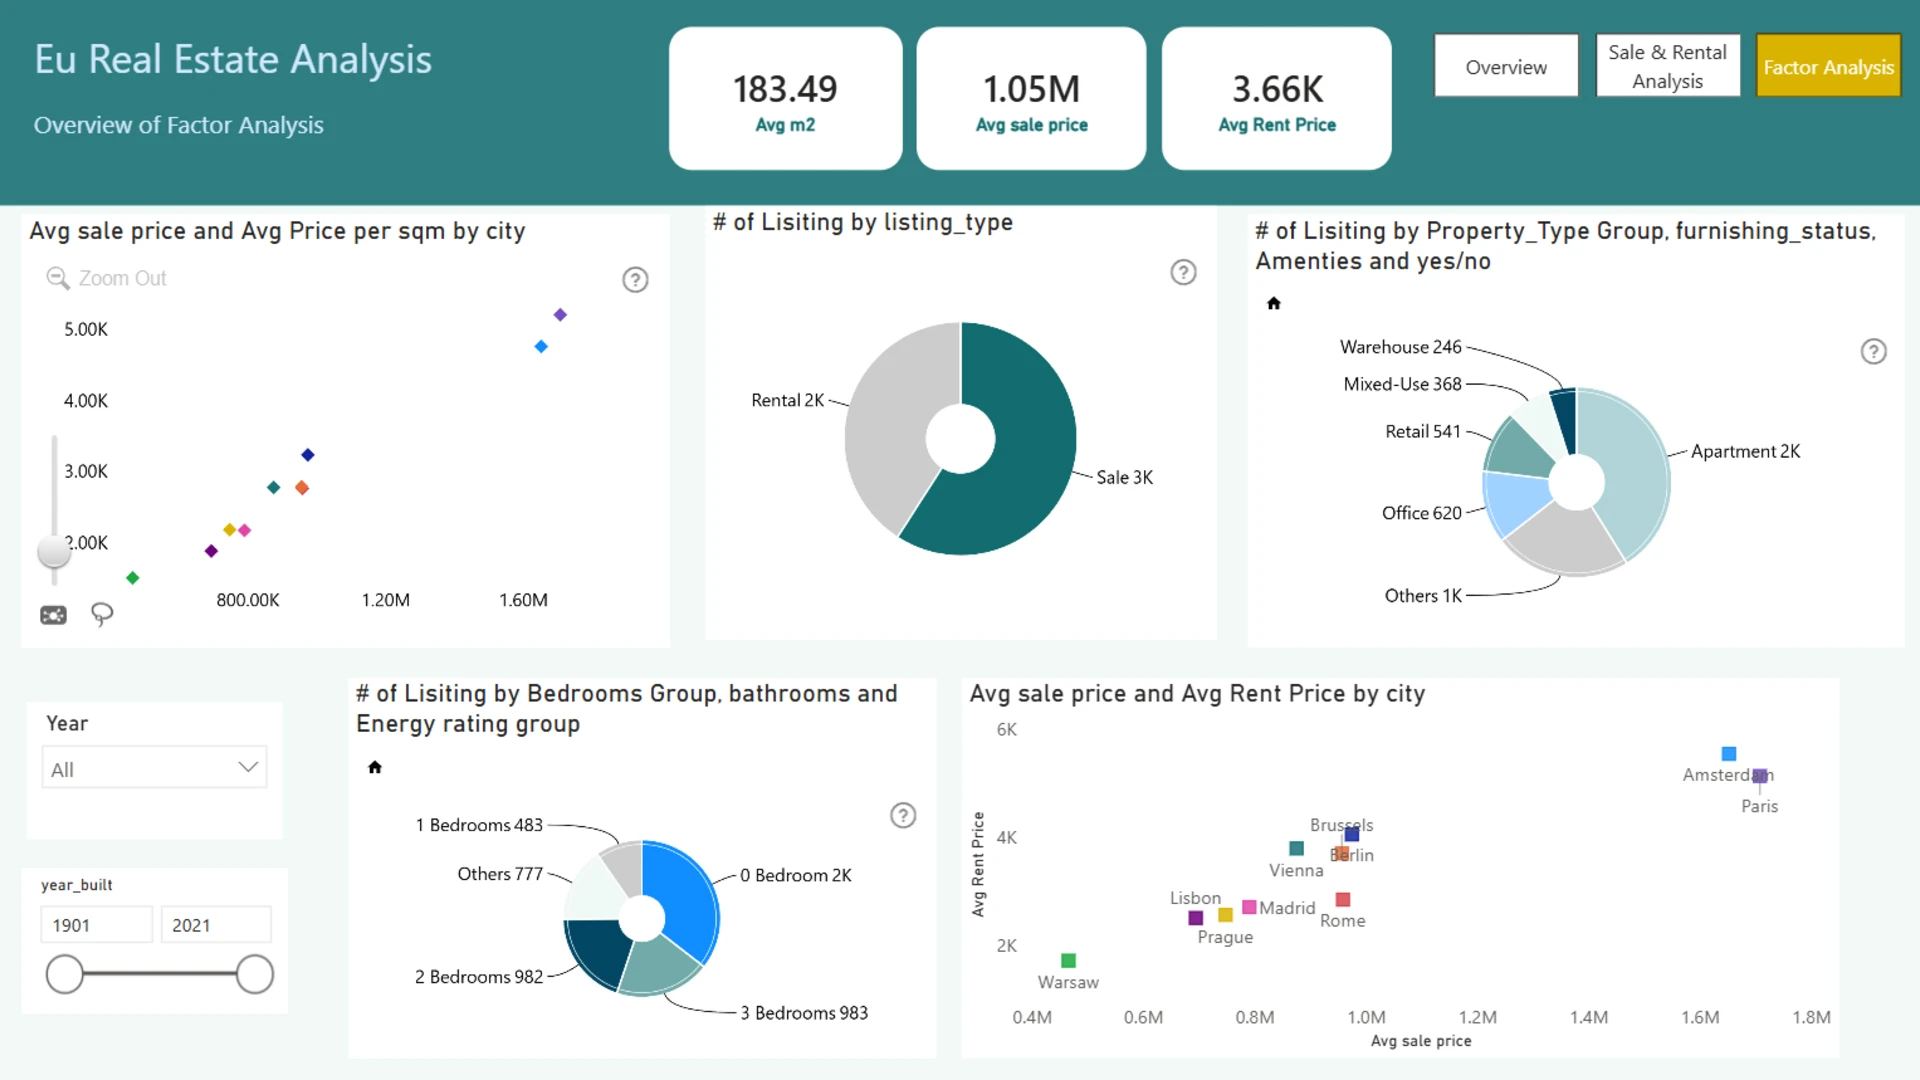
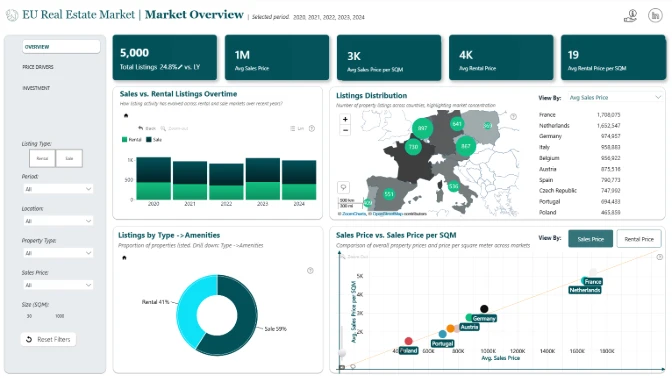
This interactive Power BI report explores the European Real Estate Market Analytics dataset using ZoomCharts Drill Down custom visuals for Power BI. It highlights property prices, price per square meter, listing activity, and property characteristics across countries and cities, helping users identify market trends, compare locations, and evaluate investment opportunities.
The report was submitted to the FP20 Analytics ZoomCharts Data Challenge #36 (March – April 2026).
Author’s Description:
This interactive Power BI report explores the EU real estate dataset, providing a comprehensive analysis of property prices, rental potential, and market trends across cities and countries.
Using advanced visualizations, the report highlights key metrics such as price per square meter, rental yield, and property characteristics to support data-driven decision-making. It enables users to examine geographic price variations, evaluate investment opportunities, and understand how factors such as property size, building age, floor level, and amenities influence pricing.
The dashboard also uncovers relationships between rental income and property values, helping identify high-performing markets and areas with strong return potential.
4U Report Challenges
Participate in data challenges, build and submit reports to get free template downloads.
Join CommunityMobile view allows you to interact with the report. To Download the template please switch to desktop view.


Was this helpful? Thank you for your feedback!
Sorry about that.
How can we improve it?