510
Property Market Trends & Valuation Analysis 3
Property Market Trends & Valuation Analysis 3
Report Author: Christopher Runnels
510
Share template with others
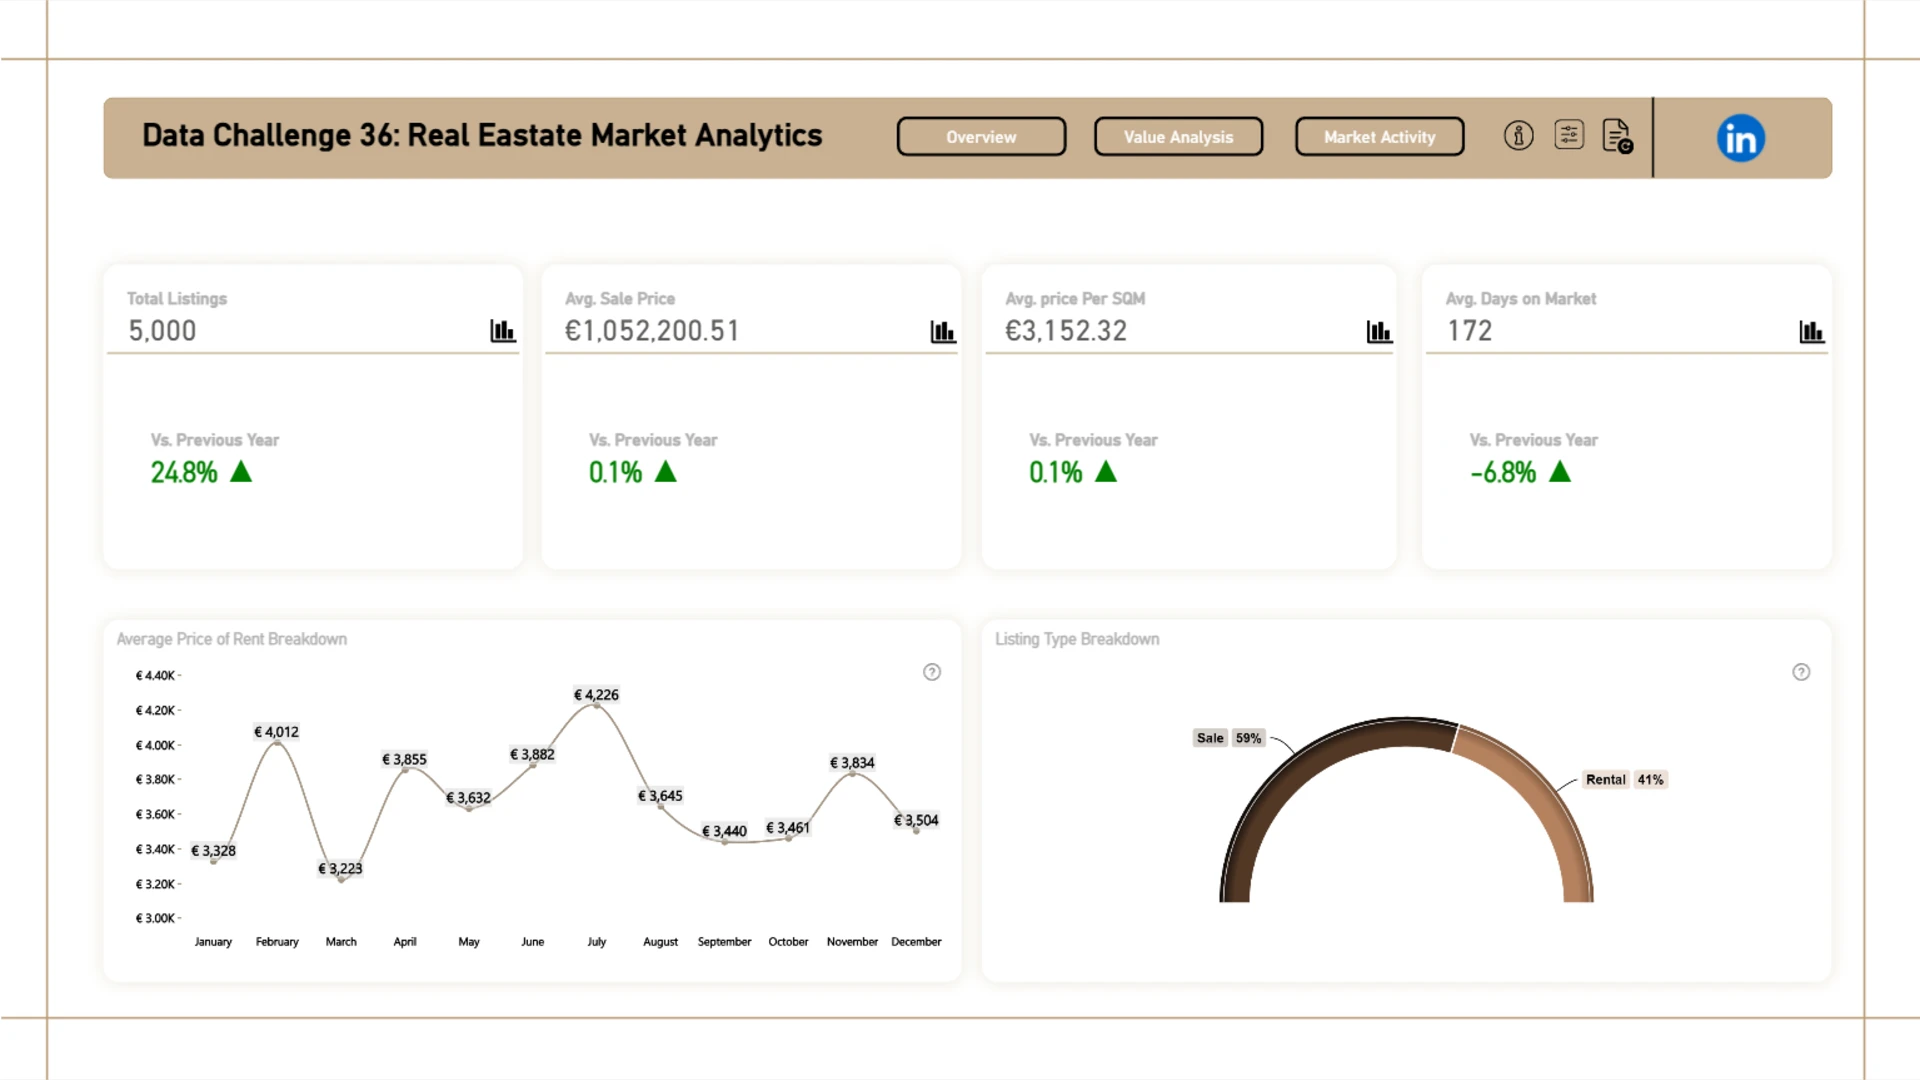
This interactive Power BI report explores the European Real Estate Market Analytics dataset using ZoomCharts Drill Down custom visuals for Power BI. It highlights property prices, price per square meter, listing activity, and property characteristics across countries and cities, helping users identify market trends, compare locations, and evaluate investment opportunities.
The report was submitted to the FP20 Analytics ZoomCharts Data Challenge #36 (March – April 2026).
Author’s Description:
This interactive Power BI dashboard provides a comprehensive view of the European real estate market, helping analysts, investors, and decision-makers understand pricing trends, market activity, and key value drivers across countries and cities. It combines metrics such as listing price, price per square meter, and property characteristics to explore variations by location, property type, and amenities.
The dashboard features dynamic filtering, drill-down capabilities, and ZoomCharts visuals, enabling seamless navigation between high-level summaries and detailed insights. It highlights market activity, investment opportunities, property value drivers, and rental trends, transforming complex data into clear, actionable insights.
ZoomCharts visuals used
4U Report Challenges
Participate in data challenges, build and submit reports to get free template downloads.
Join CommunityMobile view allows you to interact with the report. To Download the template please switch to desktop view.

Was this helpful? Thank you for your feedback!
Sorry about that.
How can we improve it?