262
Power BI Software Release Quality and Issues Dashboard
Power BI Software Release Quality and Issues Dashboard
More Report pages
Report Author: Inemesit Akaninyene
262
Share template with others
Summary
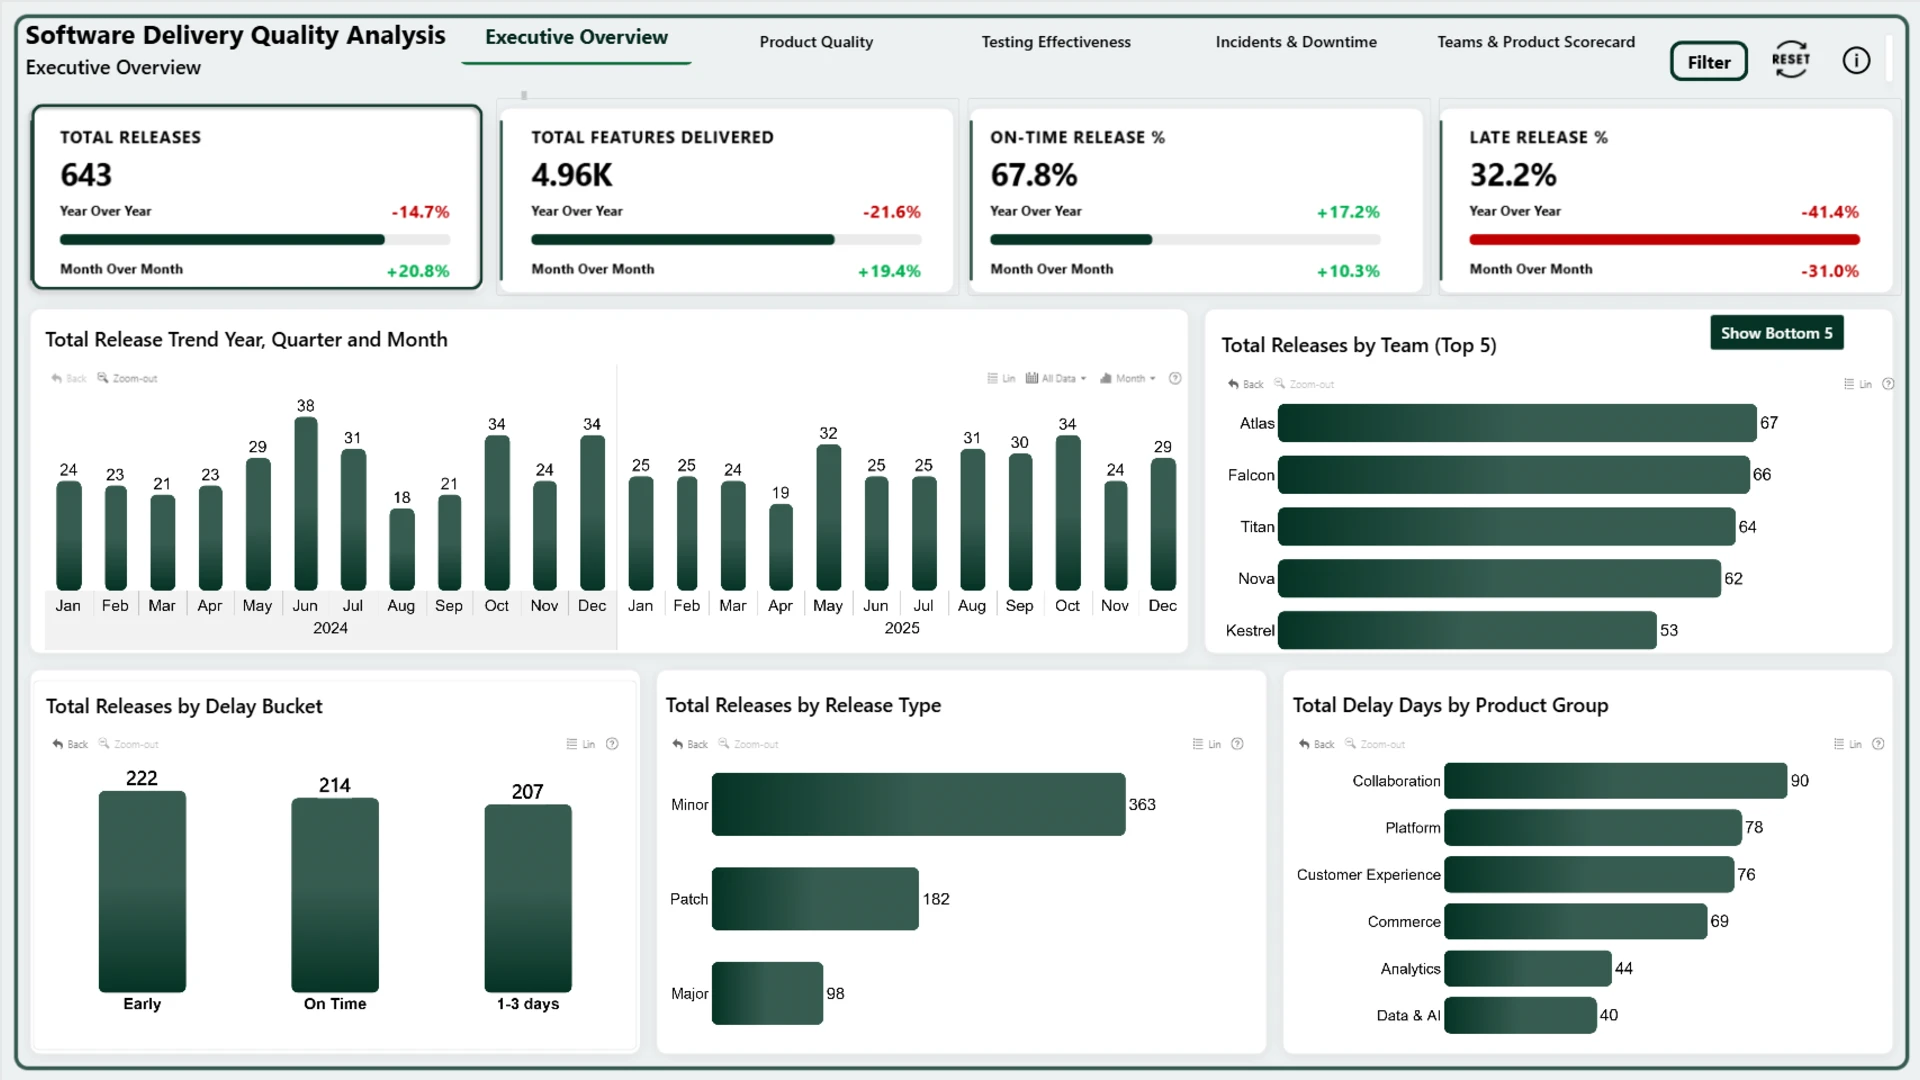
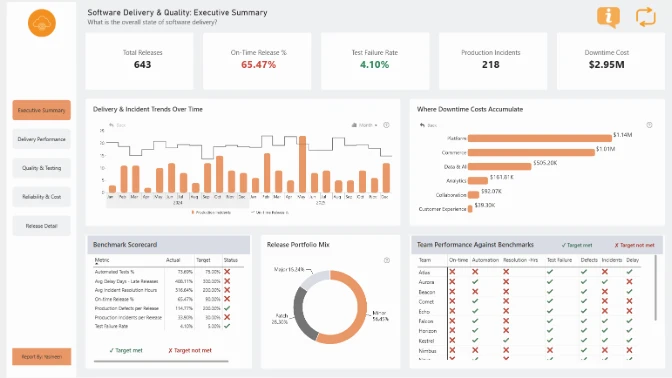
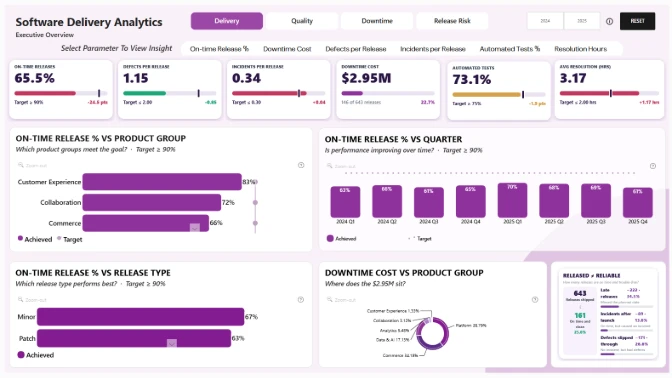
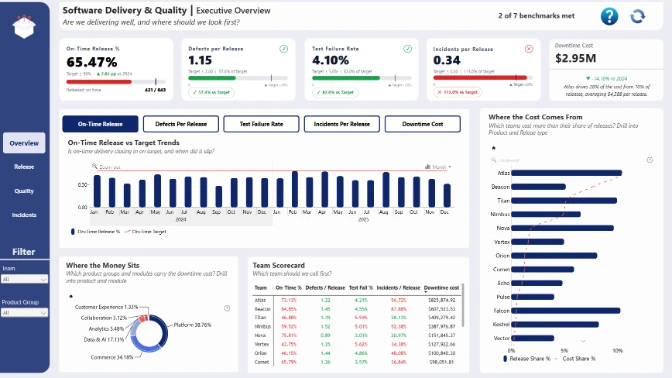
This Power BI software release dashboard by Inemesit Akaninyene helps delivery and engineering teams analyze release performance, product quality, testing, incidents, and development-team results. It covers software delivery trends across 2024 and 2025 and supports comparisons by release period, team, product group, and release type.
The report was created for the ZoomCharts Power BI Software Delivery and Quality Analytics Challenge.
Key Insights of the Power BI Software Release Quality and Issues Dashboard
The report combines release management and quality analysis in one interactive example. Its main analysis areas include:
- Release performance: monitor total releases, features delivered, on-time delivery rates, late releases, and changes over time.
- Team and product comparisons: compare release activity across development teams and identify product groups with longer delivery delays.
- Release mix: explore the distribution of Major, Minor, and Patch releases.
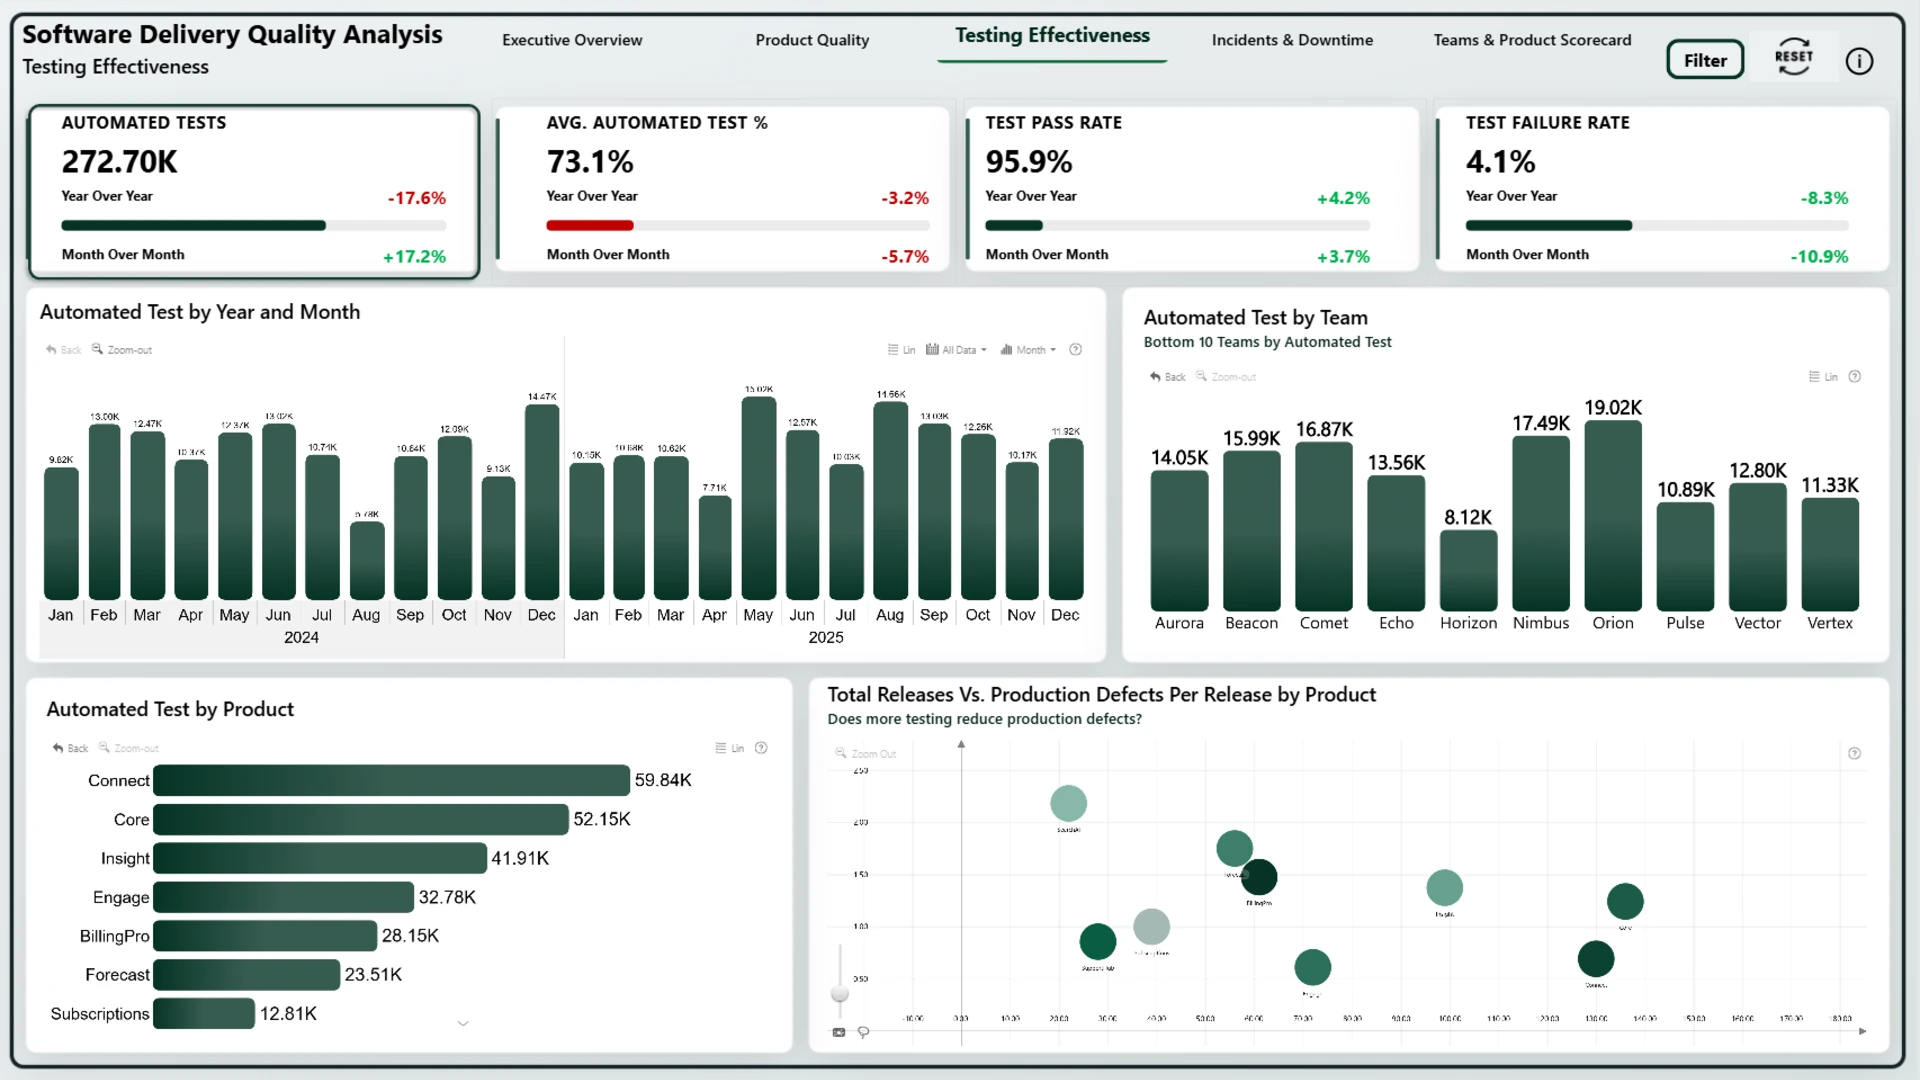
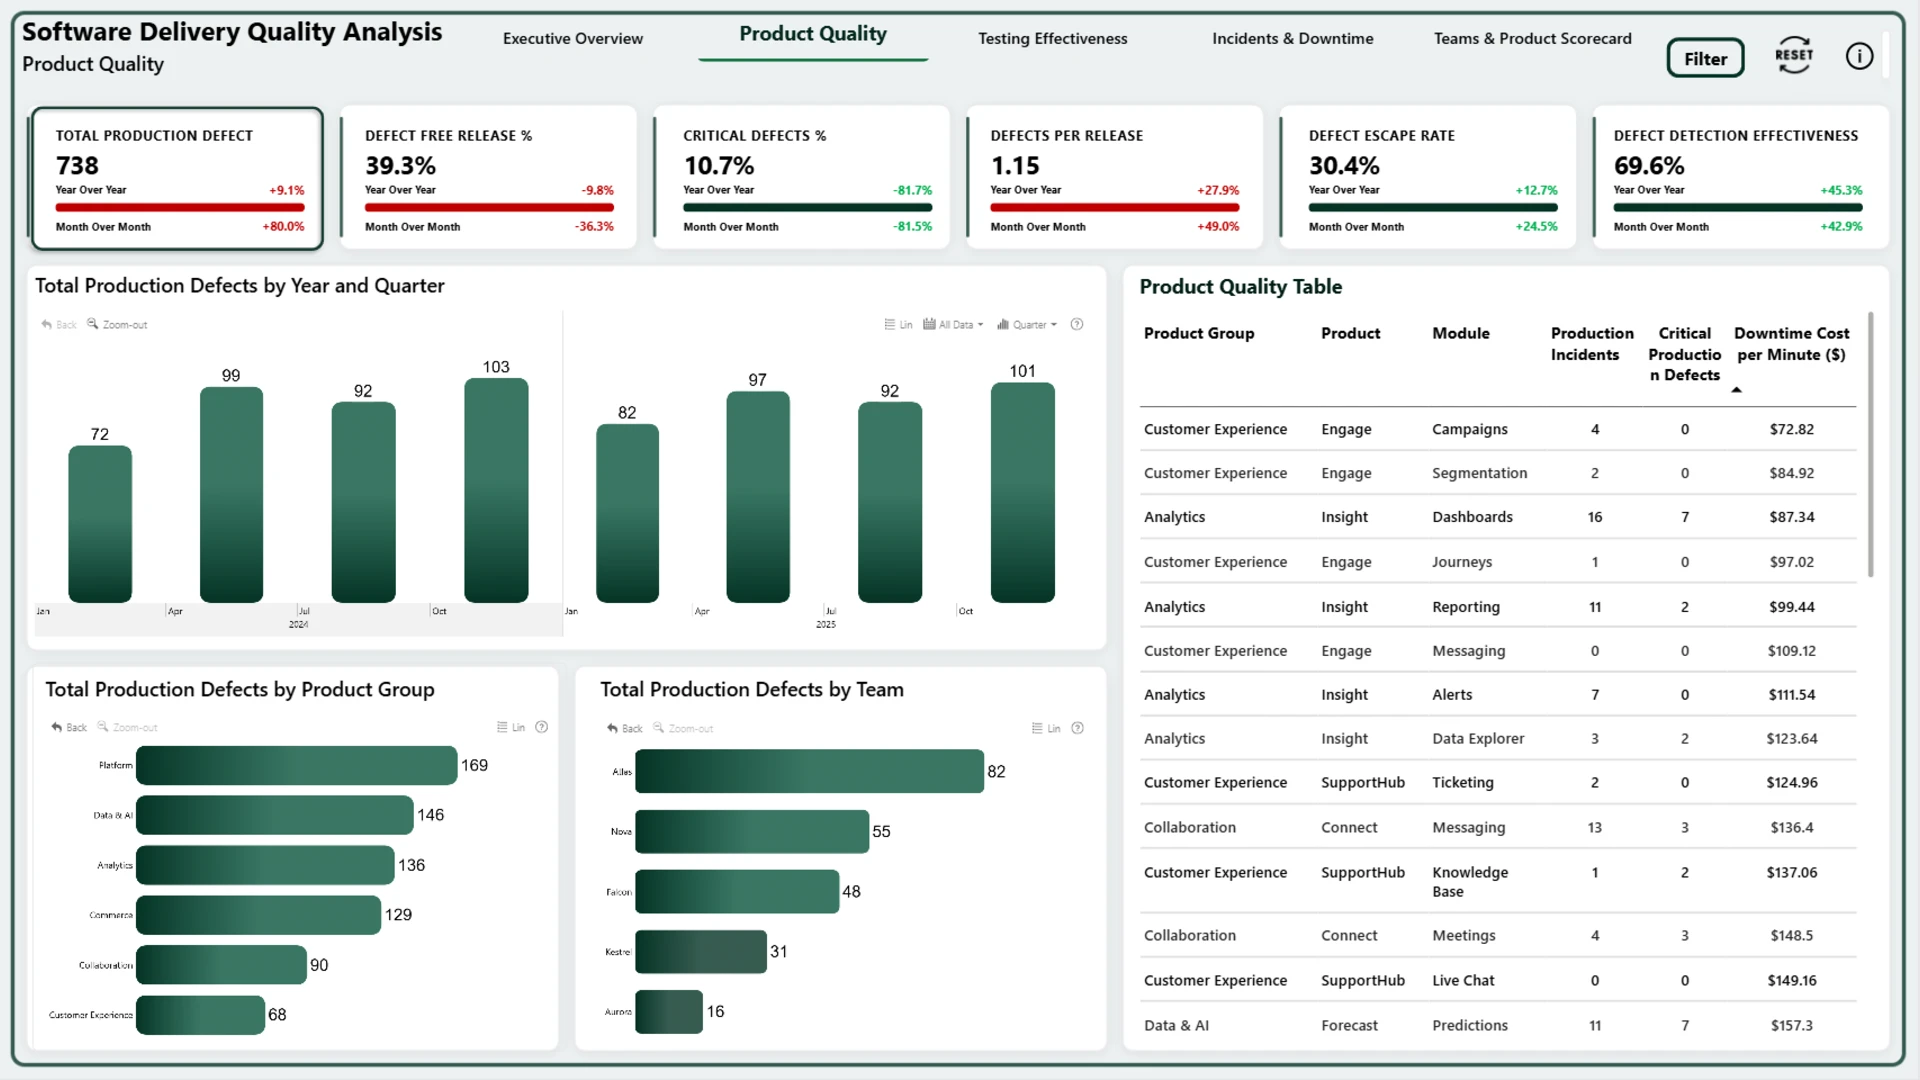
- Quality and testing: review product quality and testing-effectiveness measures alongside release delivery.
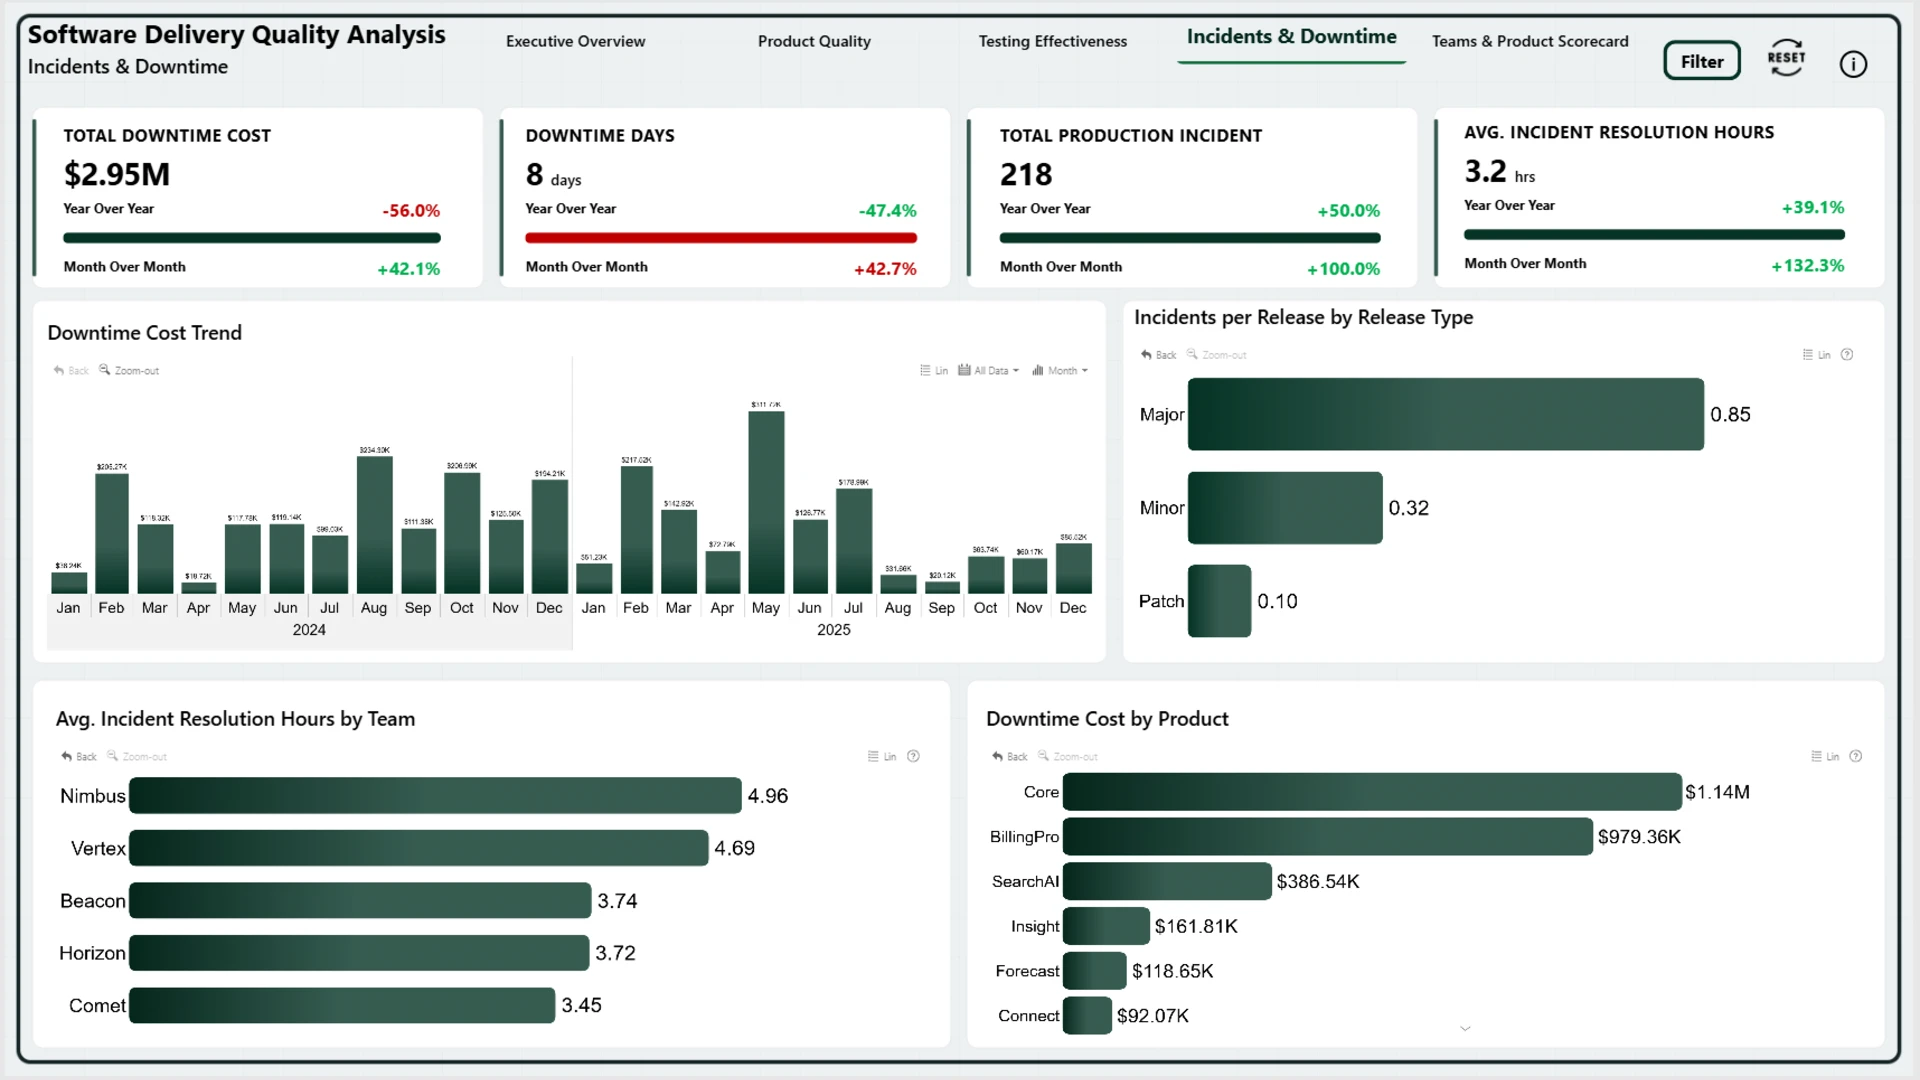
- Incidents and downtime: investigate operational issues and compare team and product results using the scorecard views.
ZoomCharts Scatter, Combo, Combo Bar, and Timeline visuals allow users to filter connected charts and investigate software delivery and quality results in greater detail.
How to Use This Power BI Software Release Quality and Issues Dashboard
Click active elements in the charts to filter by period, team, product group, or release type. Move between the delivery, quality, testing, incident, and scorecard views to examine how release performance and product issues relate.
Download the .pbix file to inspect the calculations and report settings or customize the template with your own software delivery data.
ZoomCharts visuals used



4U Report Challenges
Participate in data challenges, build and submit reports to get free template downloads.
Join CommunityMobile view allows you to interact with the report. To Download the template please switch to desktop view.
How to use a PBIX template
Preview the interactive report, download the PBIX file, open it in Power BI Desktop, and replace the same data connection with your own dataset.
Preview and download
Explore the report online and download the PBIX template file.
Open in Power BI Desktop
Open the downloaded PBIX file in Power BI Desktop.
Connect your data
Replace the sample data source with your own dataset.
Refresh and adjust
Refresh the model and update fields or visual were needed.
Save and share
Save your report and publish it for your audience.


