263
Power BI Software Delivery Dashboard: Release KPIs and Benchmarks
Power BI Software Delivery Dashboard: Release KPIs and Benchmarks
More Report pages
Report Author: Jude Onuh
263
Share template with others
Summary
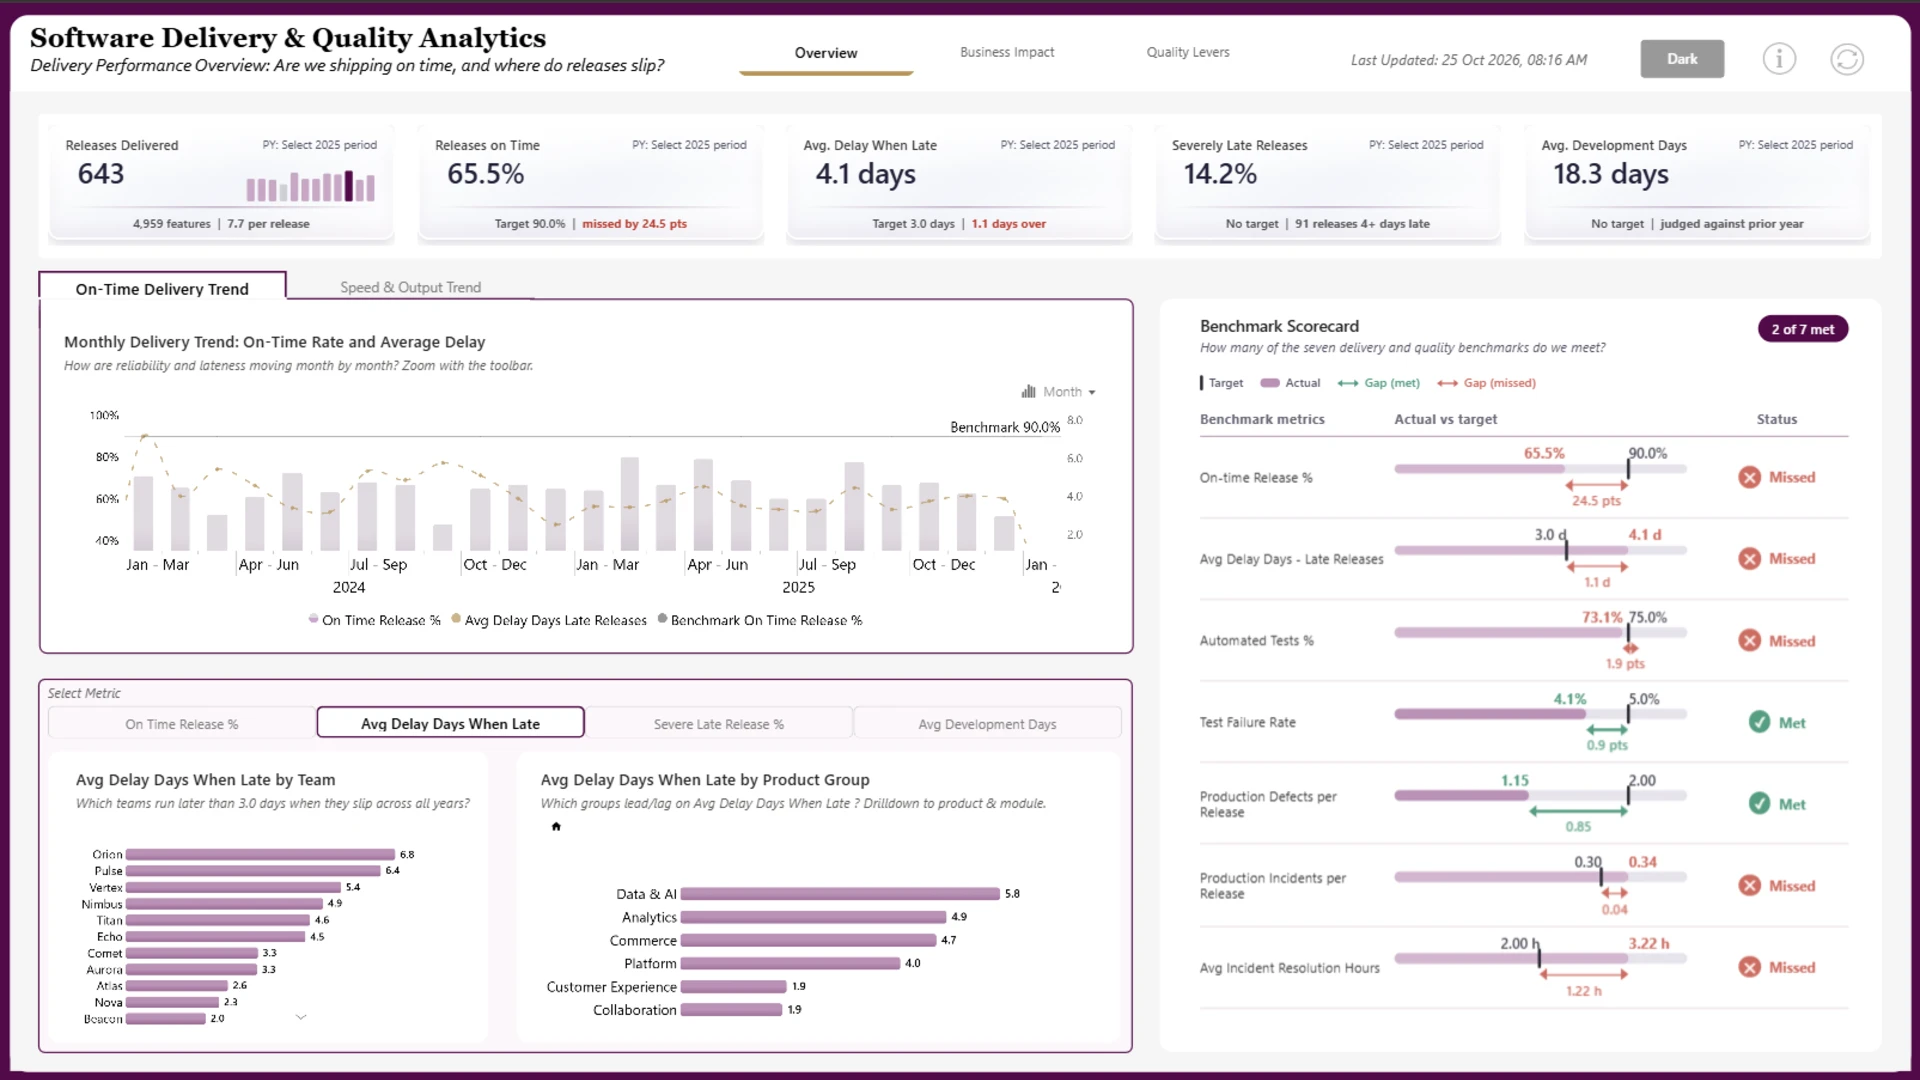
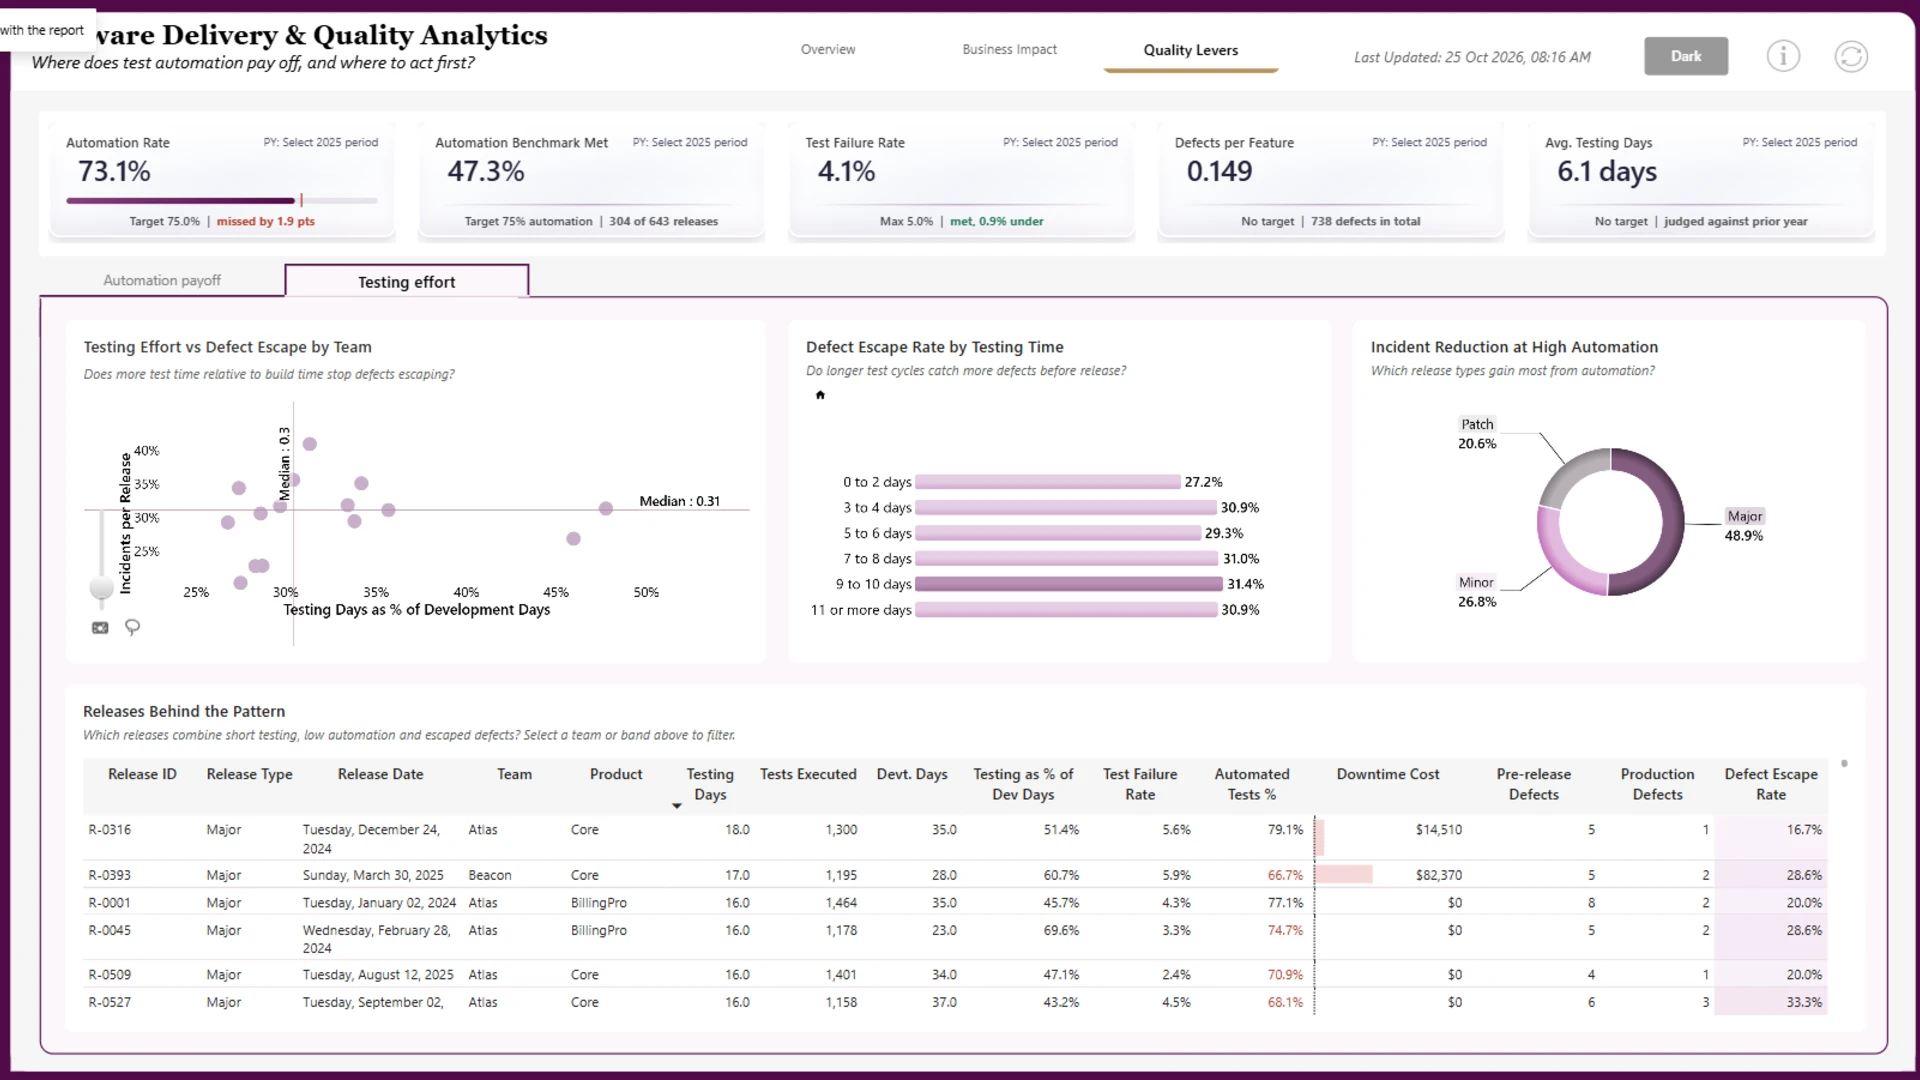
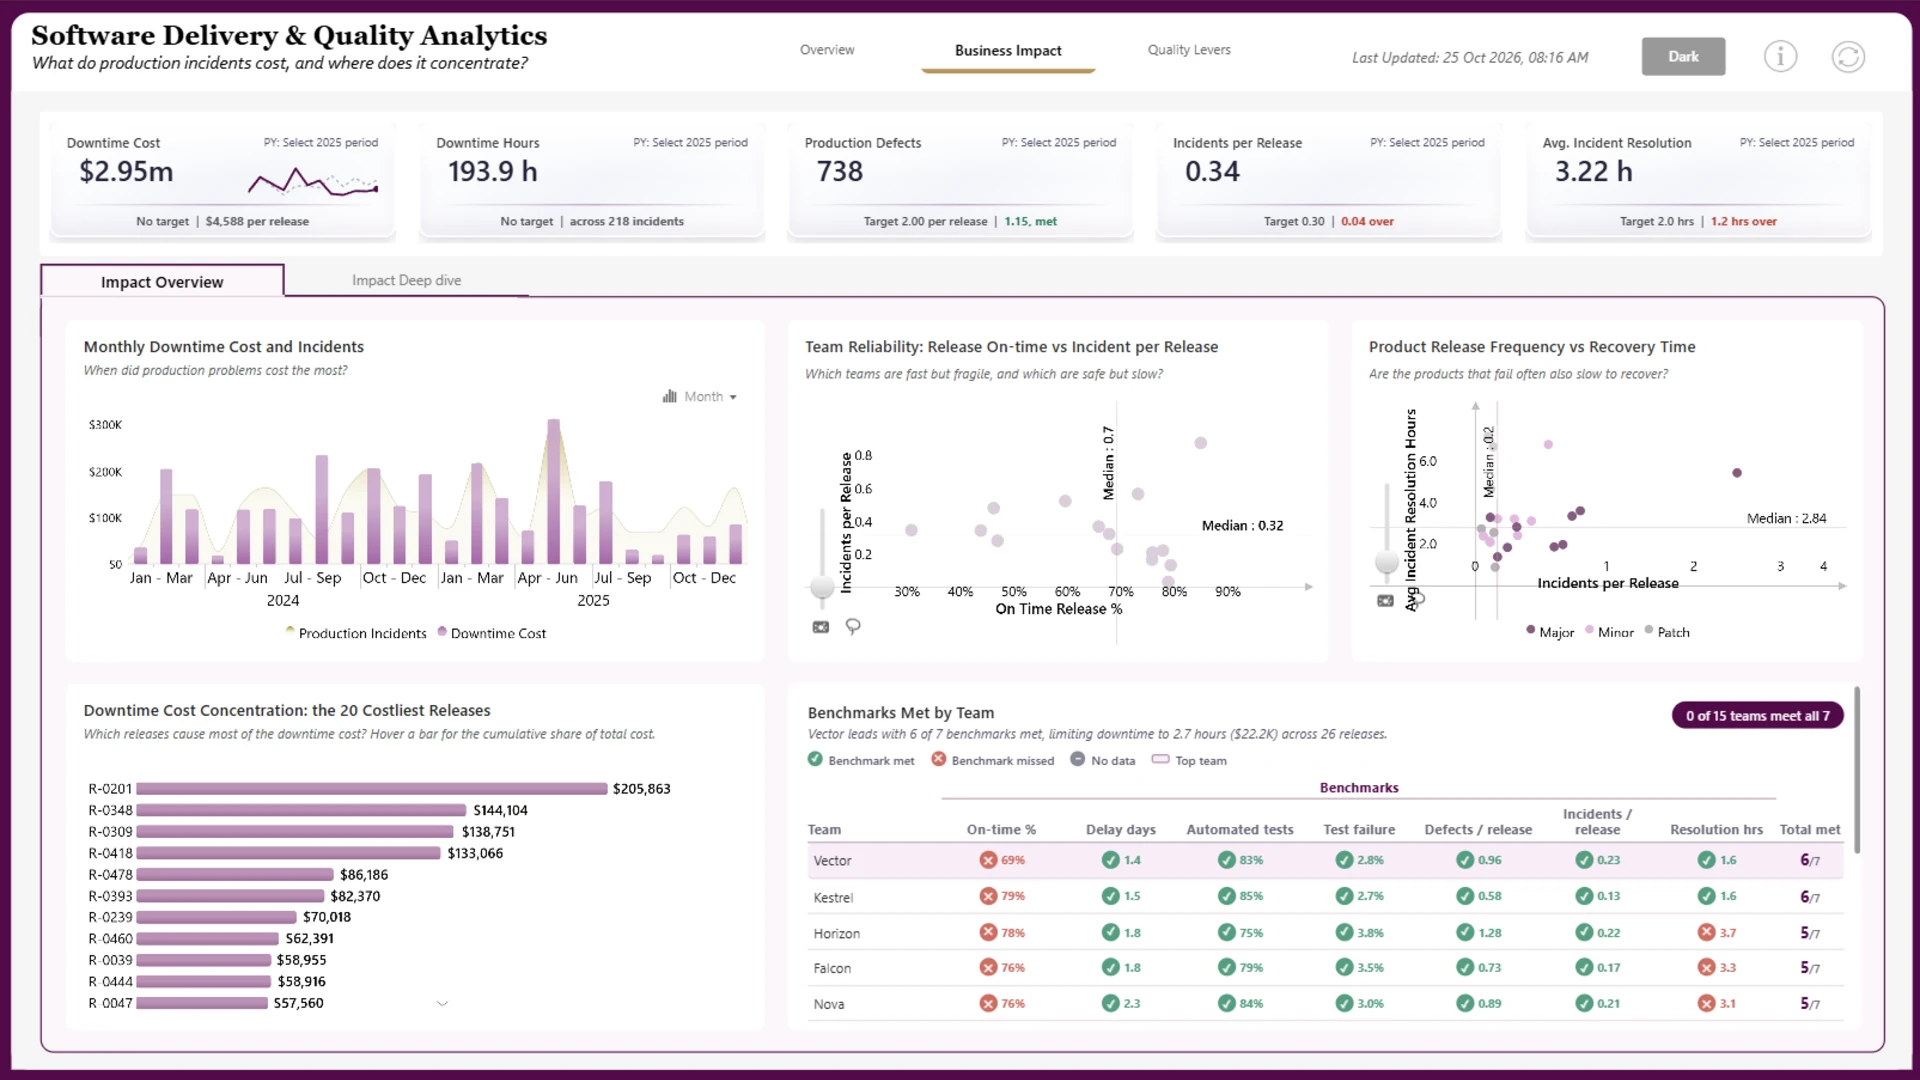
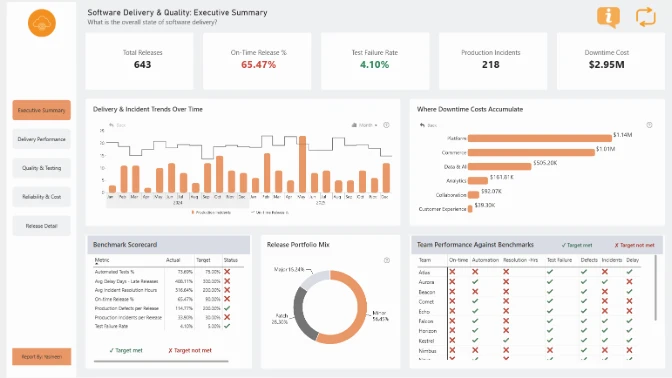
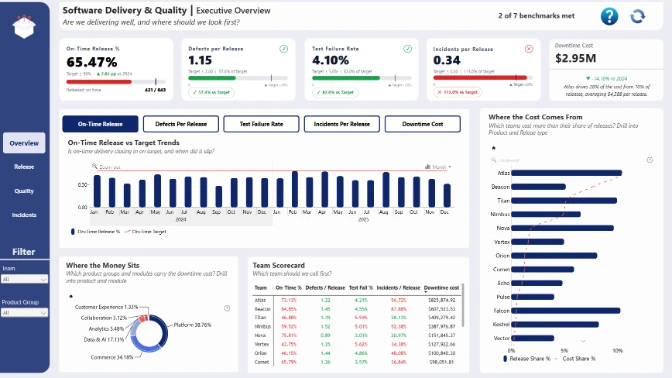
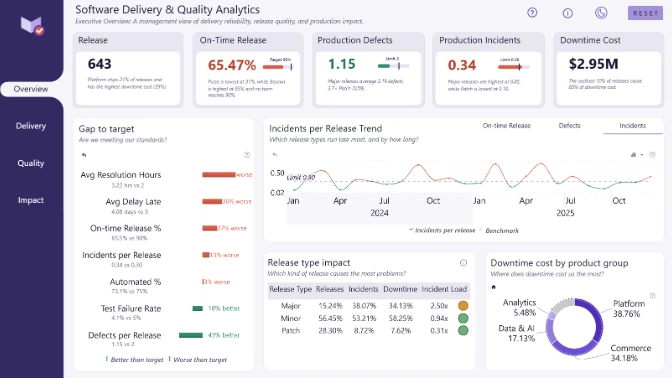
This Power BI software delivery dashboard by Jude Onuh compares release performance, software quality, and development-team efficiency against performance benchmarks. It helps users identify gaps in release management, testing, and production reliability across 2024 and 2025.
The report was created for the ZoomCharts Power BI Software Delivery and Quality Analytics Challenge.
Key Insights of the Power BI Software Delivery KPI Benchmark Dashboard
The dashboard connects delivery, quality assurance, and operational KPIs. Its main analysis areas include:
- Release delivery: track on-time delivery, average release delays, development time, and monthly software-release trends.
- KPI benchmarks: compare delivery measures with performance benchmarks to find areas that are above or below expectations.
- Team and product performance: compare development teams, product groups, products, and modules contributing to delays.
- Testing effectiveness: monitor automated testing coverage and test failure rates.
- Production reliability: review production defects, incidents per release, and average incident-resolution time.
ZoomCharts Scatter, Combo Bar, Timeline, and Donut visuals support connected filtering and detailed comparisons across software delivery, quality, and operational performance.
How to Use This Power BI Software Delivery KPI Benchmark Dashboard
Select a time period, team, product group, product, or module to filter the connected charts. Compare each KPI with its benchmark, then use the testing and incident measures to investigate possible sources of weaker delivery performance.
Download the .pbix template to review the model and calculations in Power BI Desktop or adapt the dashboard to your own software delivery data.
ZoomCharts visuals used



4U Report Challenges
Participate in data challenges, build and submit reports to get free template downloads.
Join CommunityMobile view allows you to interact with the report. To Download the template please switch to desktop view.
How to use a PBIX template
Preview the interactive report, download the PBIX file, open it in Power BI Desktop, and replace the same data connection with your own dataset.
Preview and download
Explore the report online and download the PBIX template file.
Open in Power BI Desktop
Open the downloaded PBIX file in Power BI Desktop.
Connect your data
Replace the sample data source with your own dataset.
Refresh and adjust
Refresh the model and update fields or visual were needed.
Save and share
Save your report and publish it for your audience.


