390
Power BI Sales Team Performance Dashboard
Power BI Sales Team Performance Dashboard
More Report pages
Report Author: Abubakar Iwan
390
Share template with others
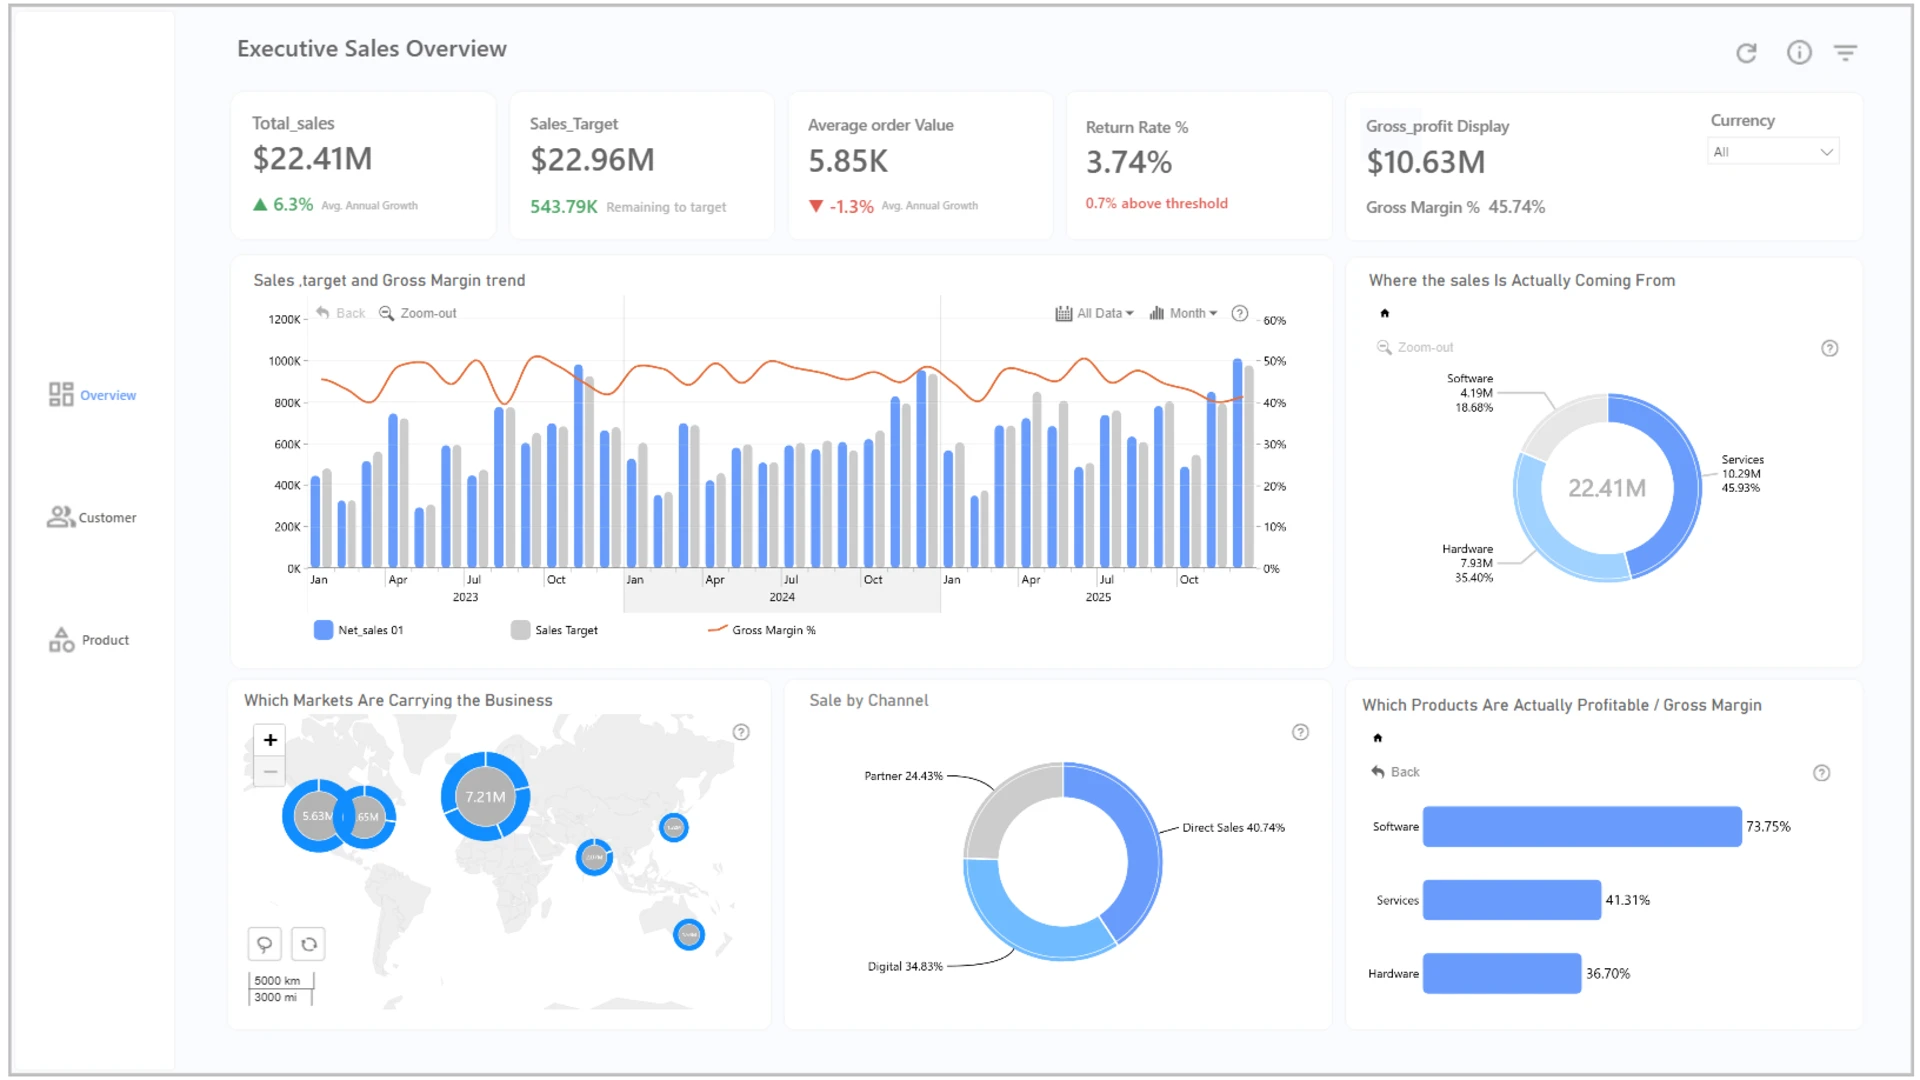
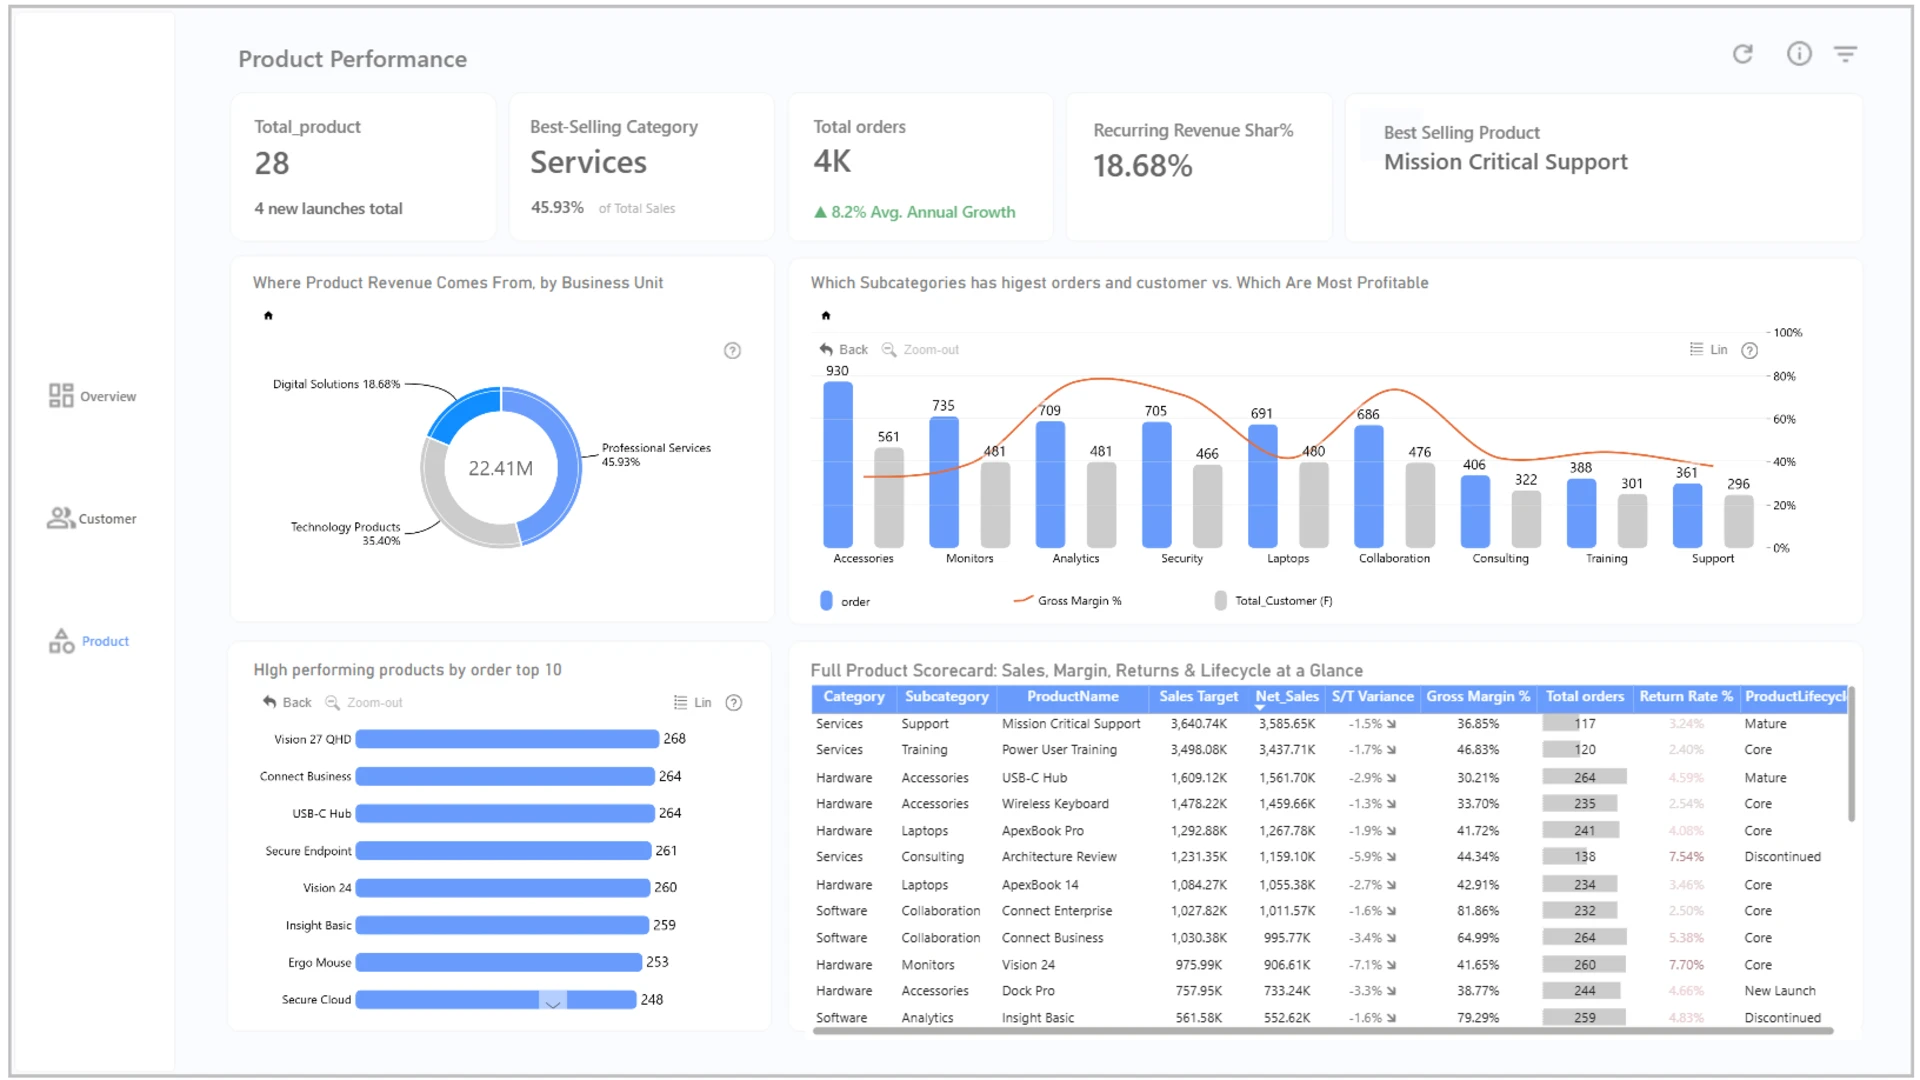
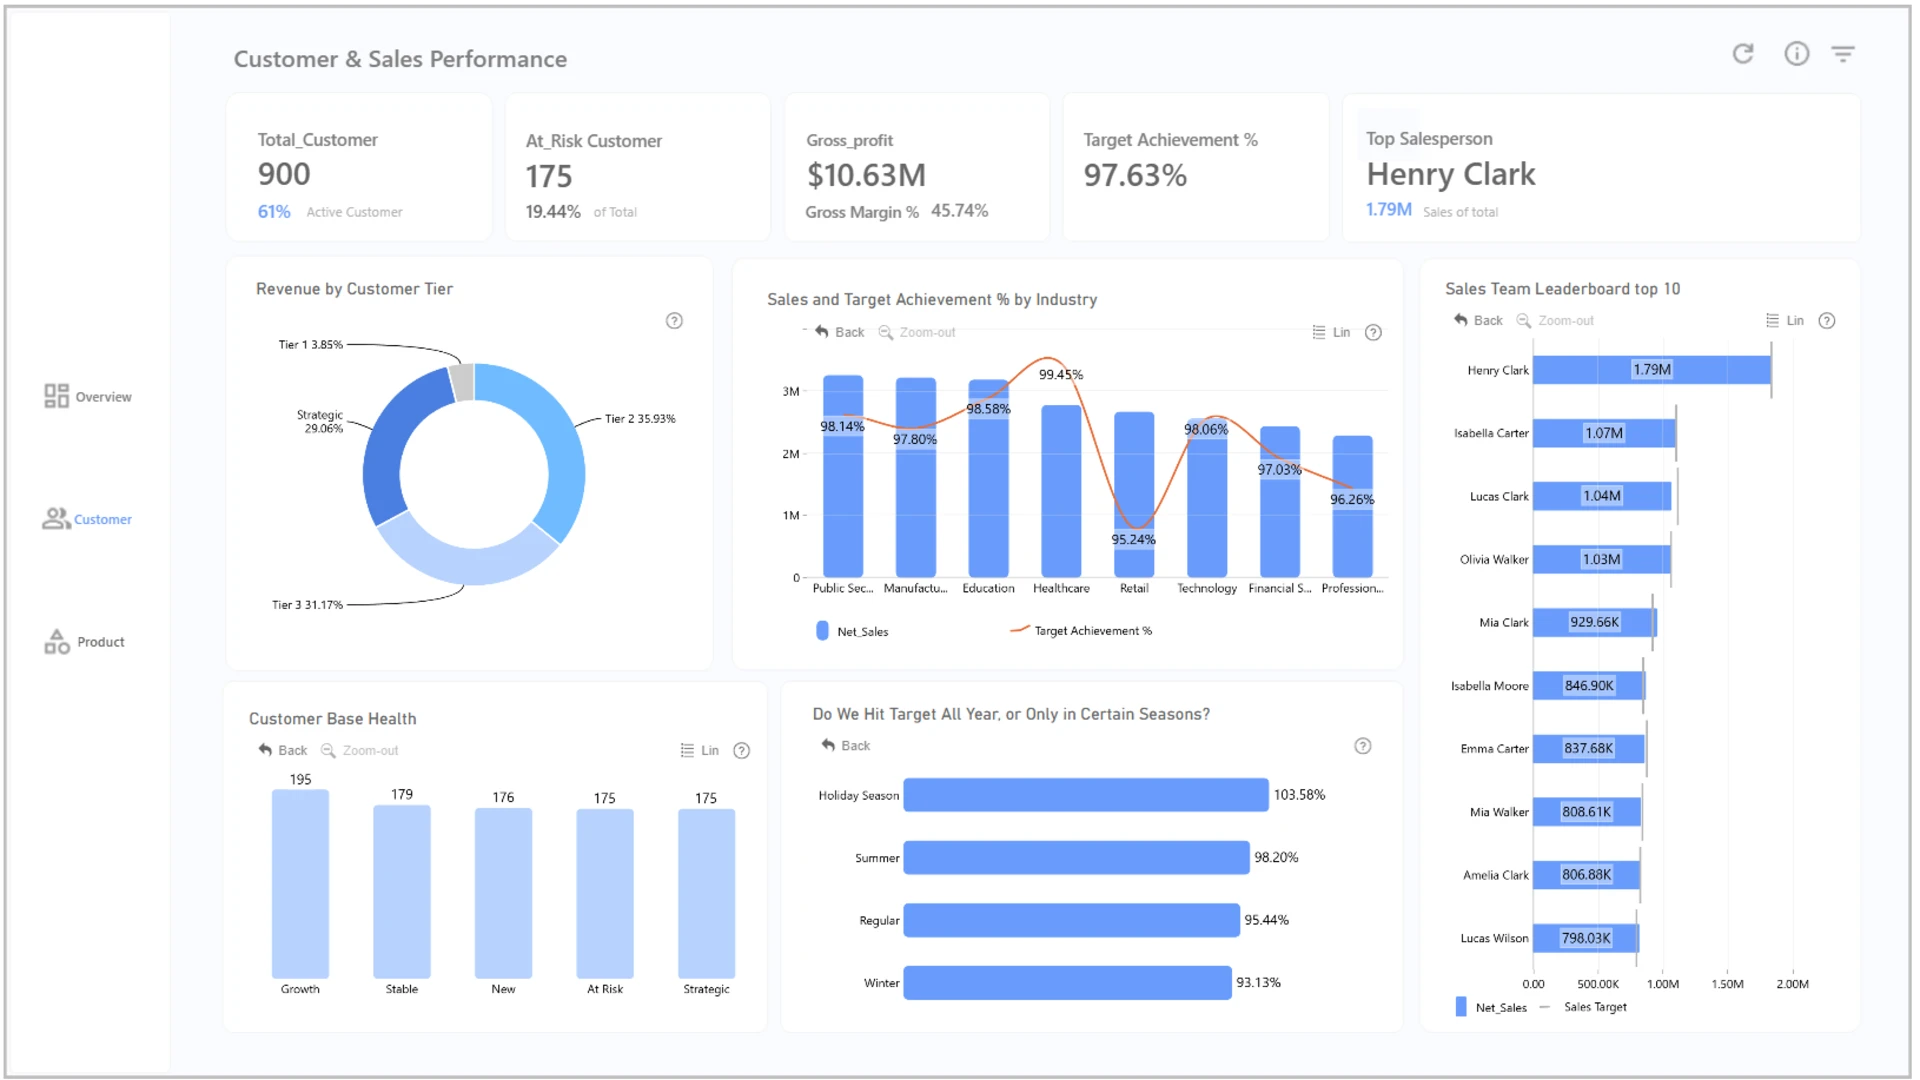
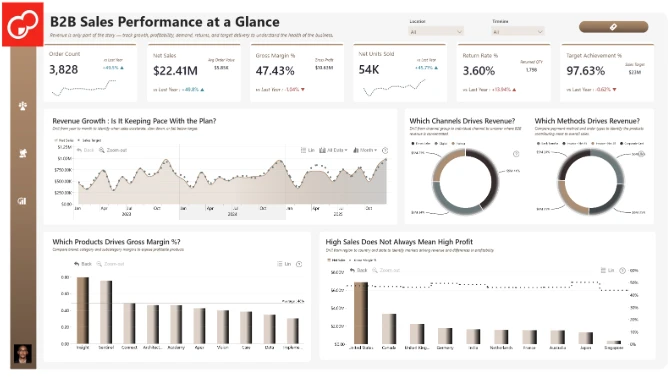
This Power BI sales team performance dashboard helps users compare teams and salespeople by sales results, target achievement, profitability, customer activity, product mix, channel, and market.
Built for the ZoomCharts 4U Report Challenge August 2026, the report applies Power BI and ZoomCharts Drill Down visuals to the global B2B sales dataset covering 2023-2025.
ZoomCharts visuals used




4U Report Challenges
Participate in data challenges, build and submit reports to get free template downloads.
Join CommunityMobile view allows you to interact with the report. To Download the template please switch to desktop view.
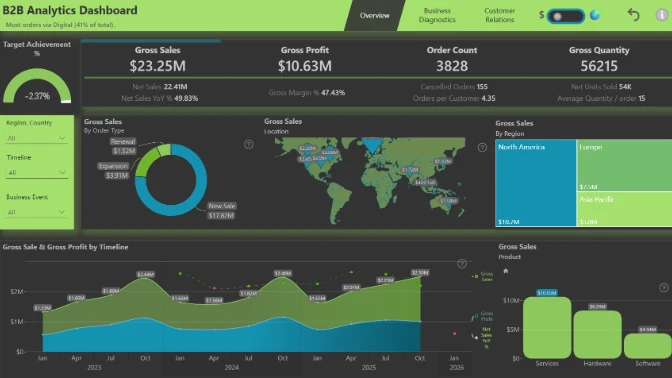
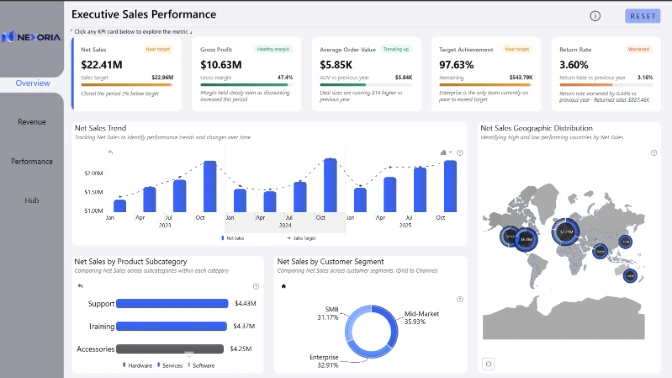
How to use a PBIX template
Preview the interactive report, download the PBIX file, open it in Power BI Desktop, and replace the same data connection with your own dataset.
Preview and download
Explore the report online and download the PBIX template file.
Open in Power BI Desktop
Open the downloaded PBIX file in Power BI Desktop.
Connect your data
Replace the sample data source with your own dataset.
Refresh and adjust
Refresh the model and update fields or visual were needed.
Save and share
Save your report and publish it for your audience.


