371
Power BI Sales Returns Analysis Dashboard
Power BI Sales Returns Analysis Dashboard
More Report pages
Report Author: Nisrin Farah
371
Share template with others
This Power BI Sales Returns Analysis Dashboard analyzes sales performance, profitability, targets, market performance, product mix, and order execution across 2023 to 2025.
The report combines Net Sales, Gross Profit, Gross Margin, Target Achievement, Order Count, Return Rate, Average Order Value, discount impact, product performance, channel performance, and geographic variance in one interactive analysis.
Executive Sales Performance
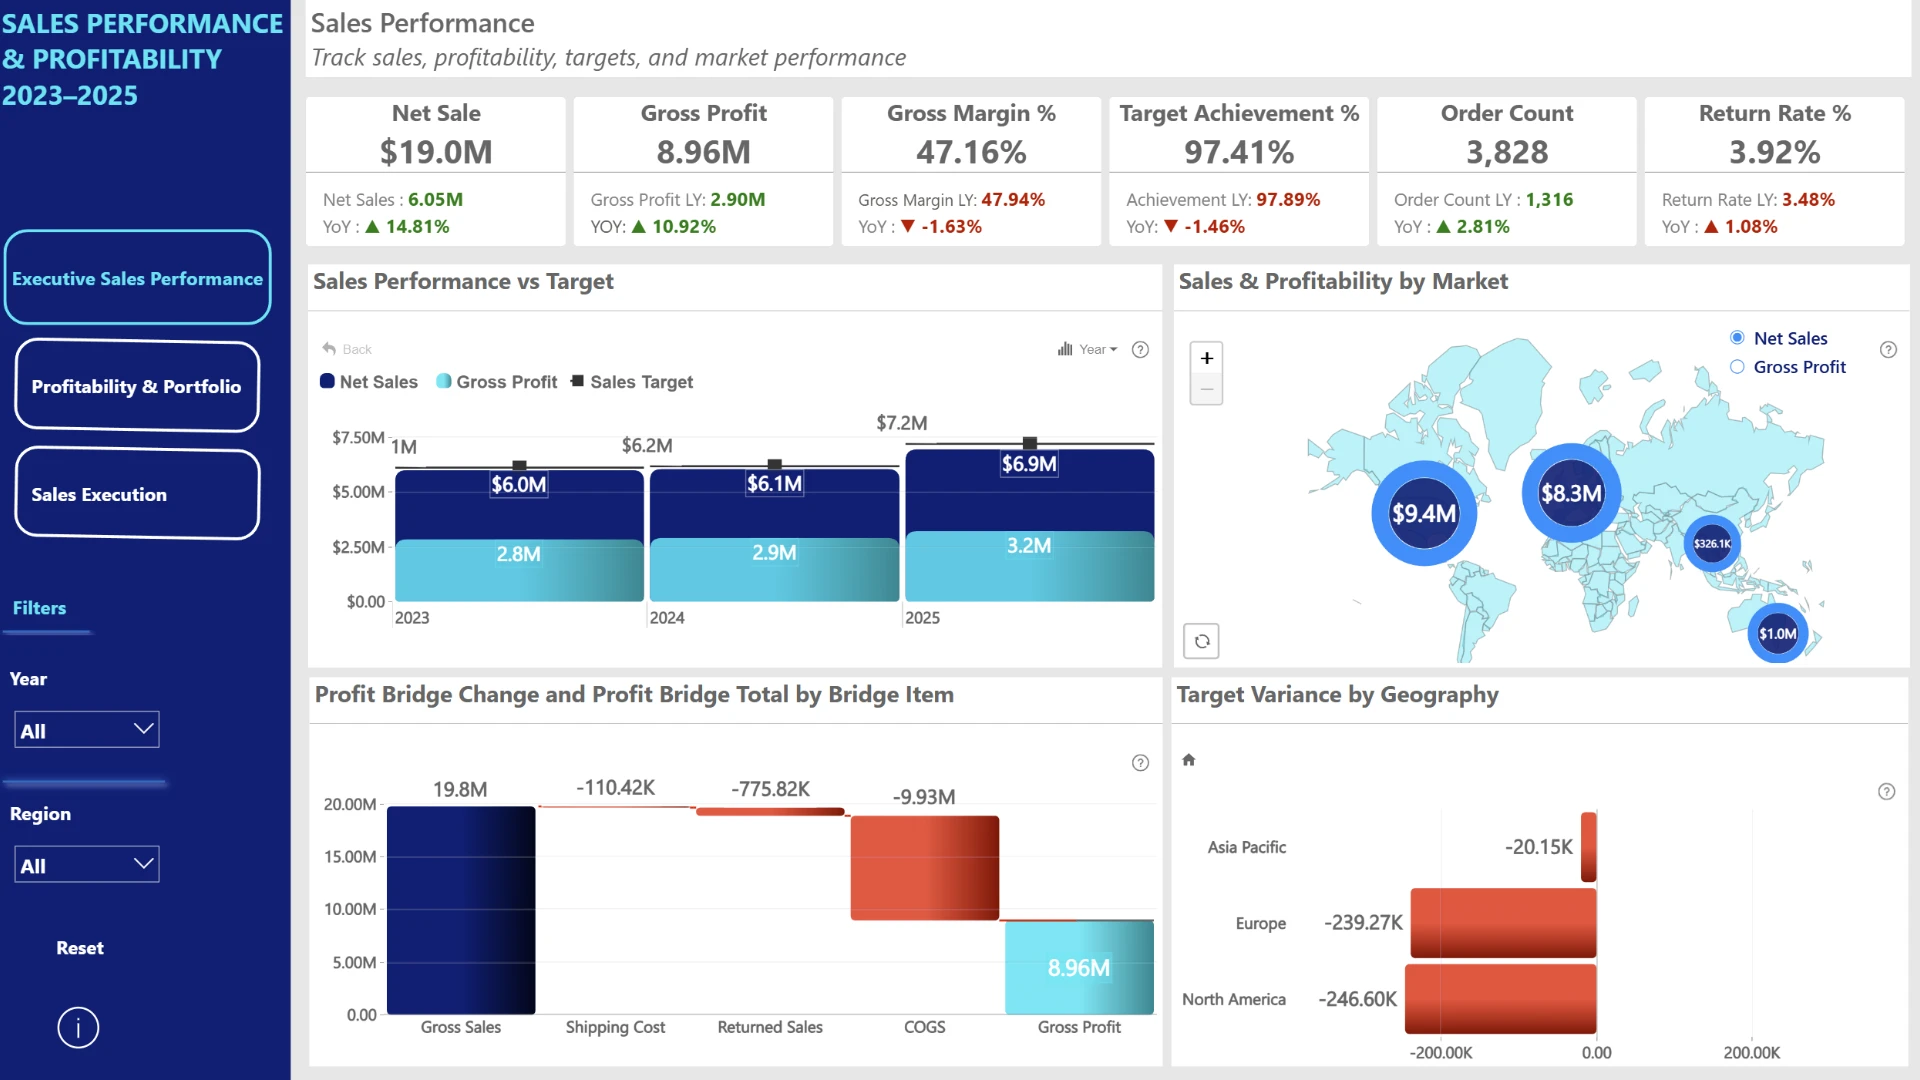
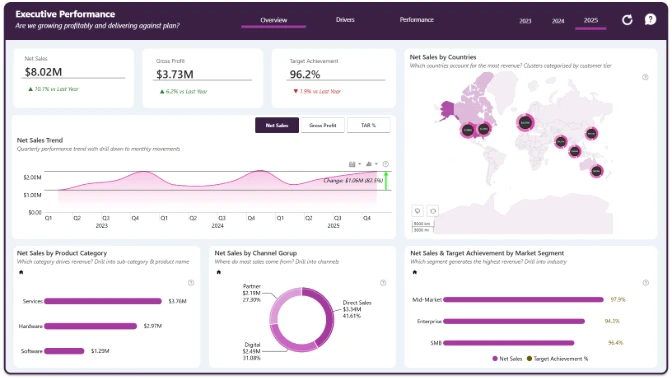
The Executive Sales Performance page provides a high-level overview of revenue, profitability, targets, order activity, returns, and market performance.
- Track Net Sales, Gross Profit, Gross Margin %, Target Achievement %, Order Count, and Return Rate %.
- Compare Net Sales and Gross Profit against Sales Target across 2023, 2024, and 2025.
- Analyze sales and profitability across global markets using regional map visuals.
- Review the transition from Gross Sales to Gross Profit through shipping costs, returned sales, and COGS.
- Identify Target Variance by Geography to see where regional sales performance is above or below target.
- Filter the analysis by year and region.
Profitability & Portfolio
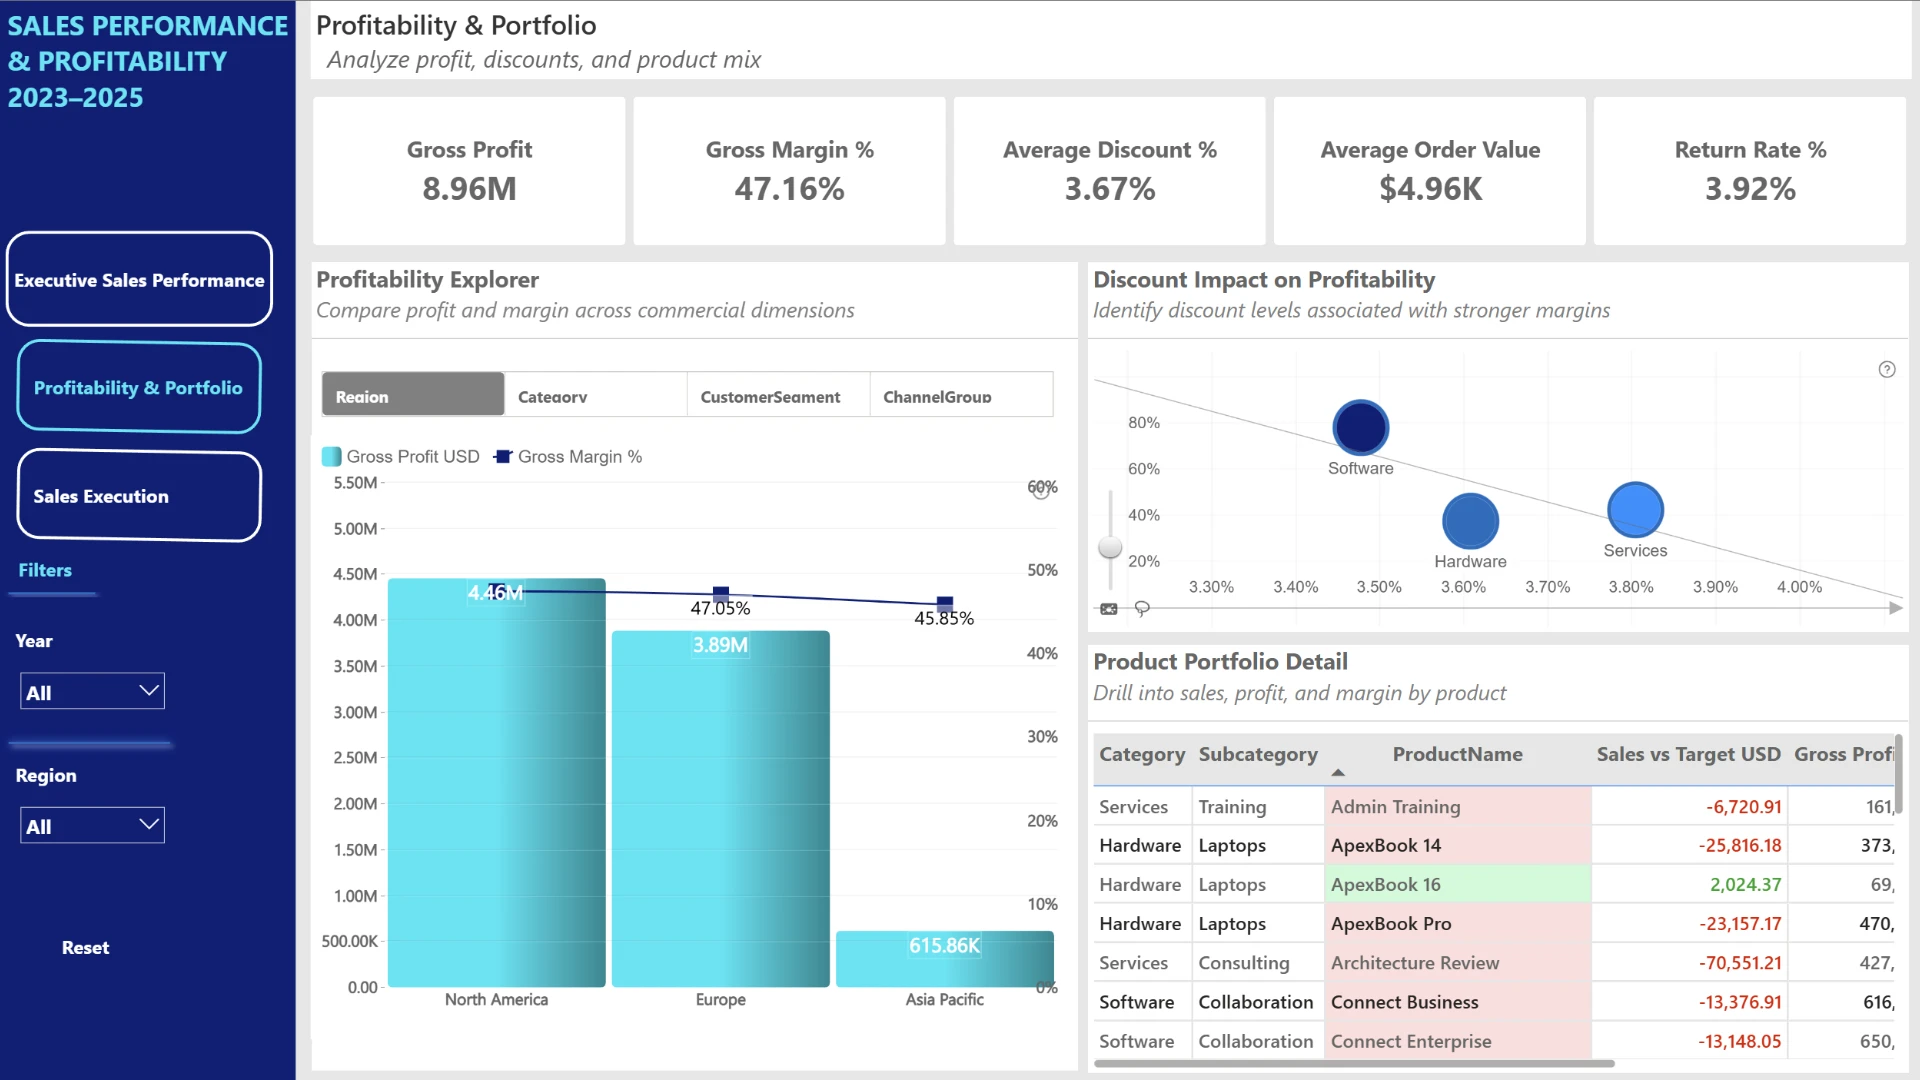
The Profitability & Portfolio page focuses on profit, discounts, product mix, and margin performance across different commercial dimensions.
- Track Gross Profit, Gross Margin %, Average Discount %, Average Order Value, and Return Rate %.
- Compare Gross Profit and Gross Margin across regions, categories, customer segments, and channel groups.
- Analyze the relationship between discount levels and profitability.
- Identify product categories with stronger or weaker margin performance.
- Review detailed product performance using Category, Subcategory, Product Name, Sales vs Target, and Gross Profit.
- Drill into individual products to investigate sales and profitability performance.
Markets & Sales Execution
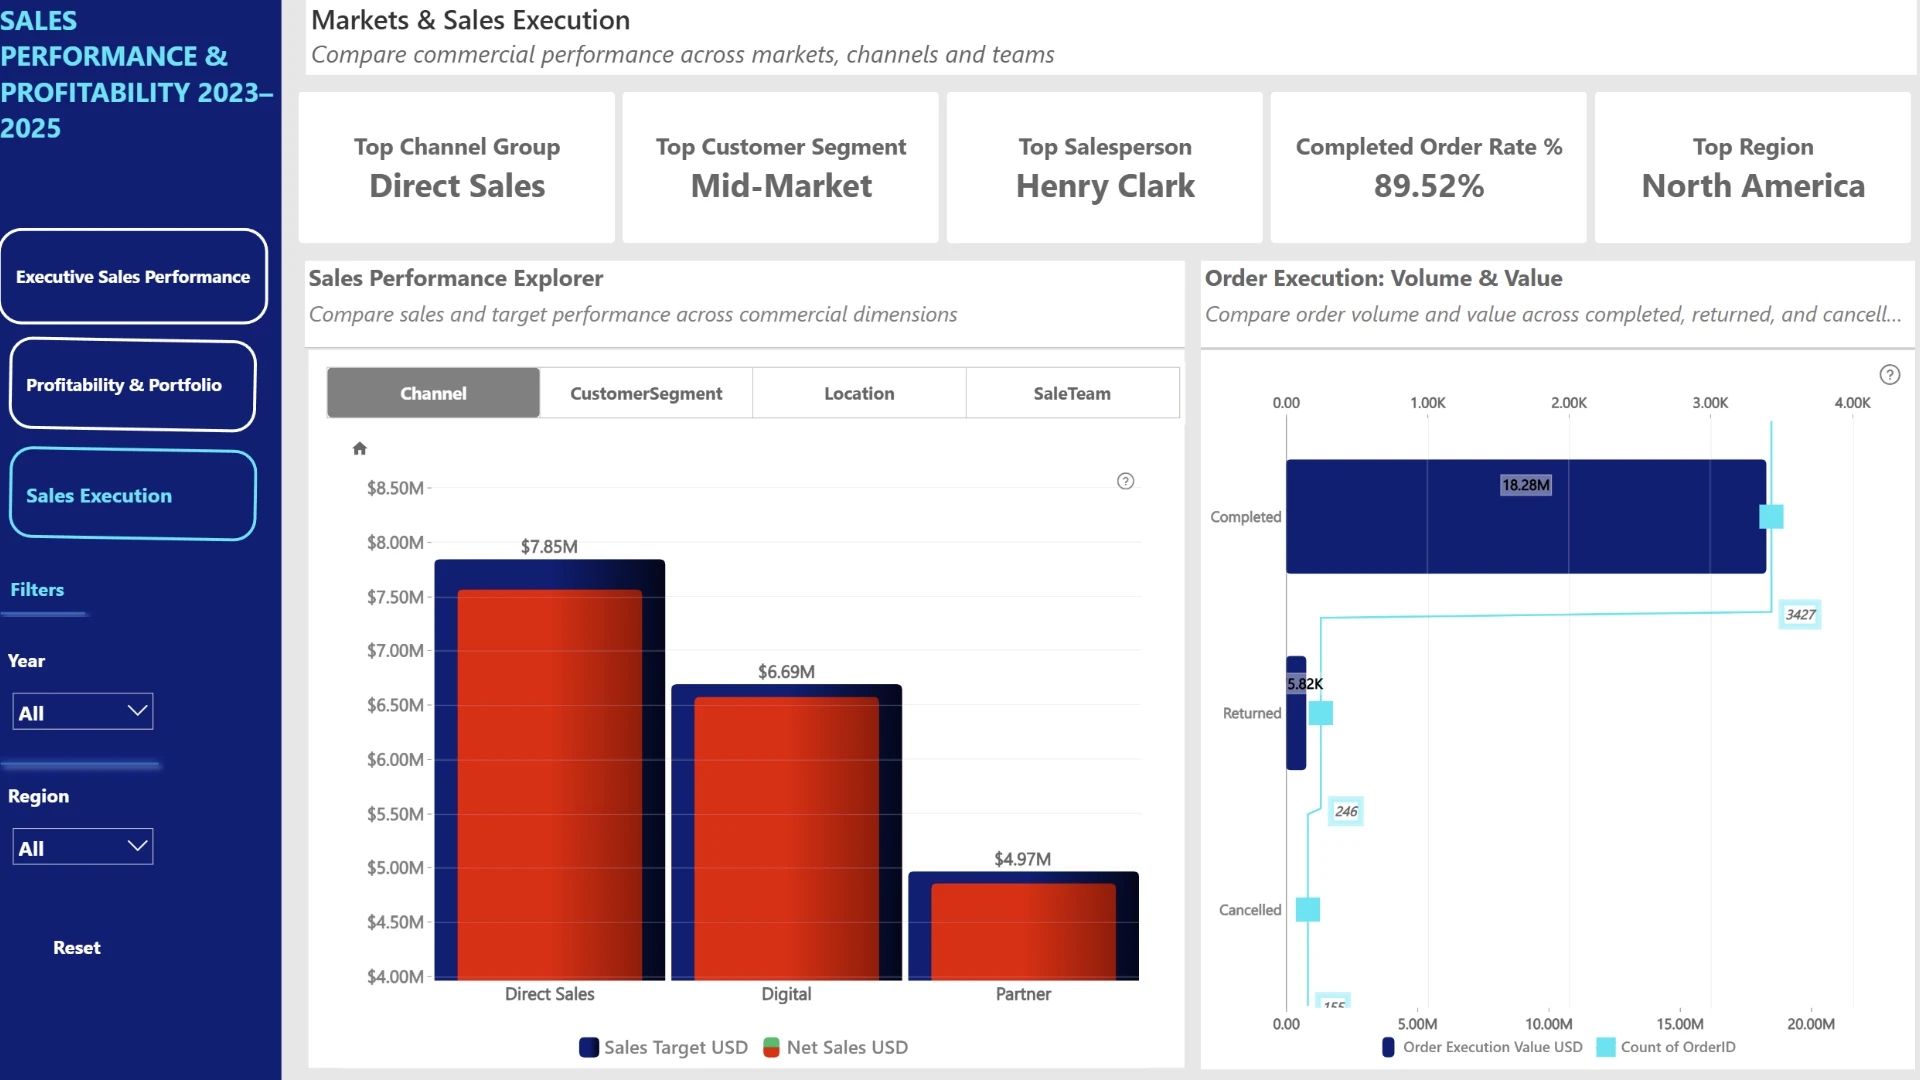
The Markets & Sales Execution page compares commercial performance across channels, customer segments, locations, sales teams, and order outcomes.
- Identify the top channel group, customer segment, salesperson, region, and completed order rate.
- Compare Net Sales against Sales Target across Direct Sales, Digital, and Partner channels.
- Explore sales performance across Channel, Customer Segment, Location, and Sales Team.
- Compare completed, returned, and cancelled orders using both order value and order count.
- Identify which sales channels contribute the most revenue and which fall furthest below target.
- Evaluate order execution quality by comparing completed, returned, and cancelled sales.
Target & Variance Analysis
The dashboard includes direct target and variance analysis, making it possible to compare actual performance with expected sales across markets, products, and channels.
- Track overall Target Achievement %.
- Compare Net Sales with Sales Target over time.
- Analyze Target Variance by Geography.
- Review Sales vs Target at individual product level.
- Compare target performance across major sales channels.
Returns & Order Quality
Returns are integrated throughout the report to show how order quality affects revenue and profitability.
- Monitor the overall Return Rate %.
- Compare current return performance with the previous year.
- Measure the financial impact of Returned Sales within the profit bridge.
- Compare returned and cancelled orders with completed orders.
- Use return information alongside profitability and product metrics to identify possible quality issues.
Interactive Exploration
The report is structured across executive performance, profitability, and sales execution pages, allowing users to move from high-level KPIs into detailed product, market, and channel analysis.
- Filter analysis by year and region.
- Explore profitability by region, category, customer segment, and channel group.
- Compare sales performance across channels, customer segments, locations, and teams.
- Drill into detailed product-level sales and profitability results.
- Analyze target variance and return performance alongside core sales KPIs.
ZoomCharts visuals used






4U Report Challenges
Participate in data challenges, build and submit reports to get free template downloads.
Join CommunityMobile view allows you to interact with the report. To Download the template please switch to desktop view.
How to use a PBIX template
Preview the interactive report, download the PBIX file, open it in Power BI Desktop, and replace the same data connection with your own dataset.
Preview and download
Explore the report online and download the PBIX template file.
Open in Power BI Desktop
Open the downloaded PBIX file in Power BI Desktop.
Connect your data
Replace the sample data source with your own dataset.
Refresh and adjust
Refresh the model and update fields or visual were needed.
Save and share
Save your report and publish it for your audience.


