399
Power BI Sales Performance & Profitability Dashboard
Power BI Sales Performance & Profitability Dashboard
More Report pages
Report Author: Javier Lim
399
Share template with others
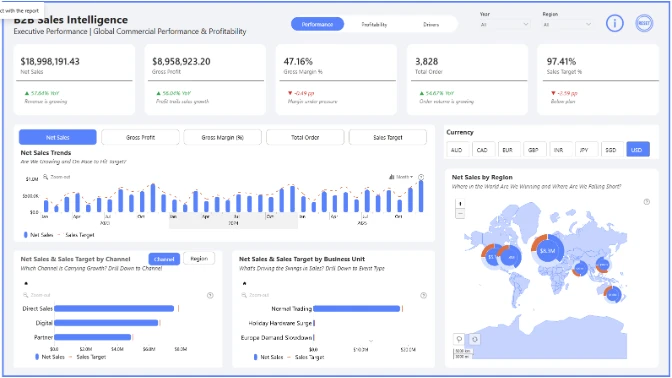
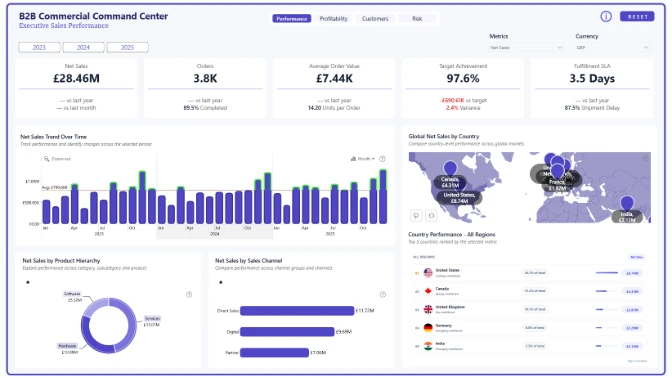
This Power BI Sales Variance Dashboard analyzes B2B sales performance, profitability, targets, channels, regions, products, customer segments, and returns across multiple years.
The report helps users understand how actual sales compare with targets, where profit is generated, which regions and categories drive performance, and where returns reduce business value.
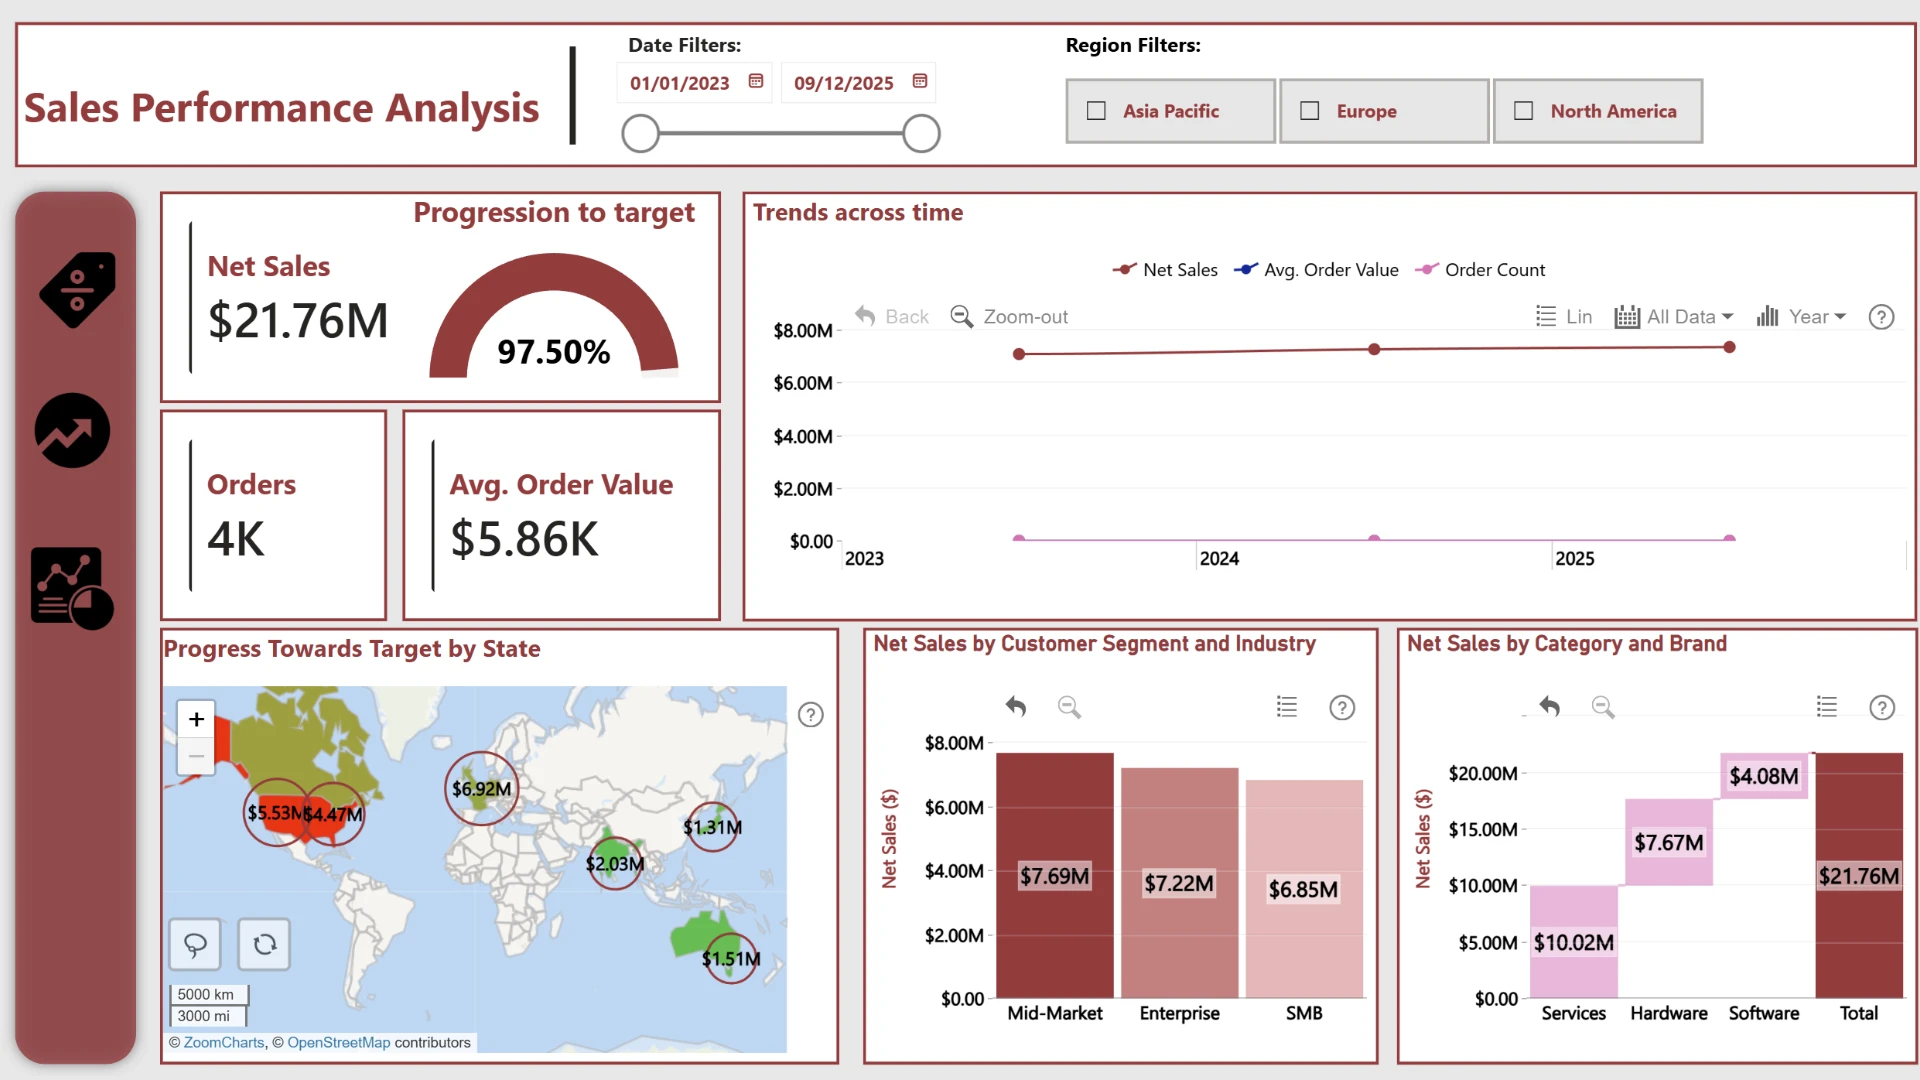
Sales Performance Analysis
The Sales Performance Analysis page gives a high-level view of commercial performance and target progression across the selected period.
- Track Net Sales, Orders, Average Order Value, and progression toward target.
- Compare Net Sales, Average Order Value, and Order Count across years.
- Analyze progress toward target by state and geographic market.
- Compare Net Sales across Mid-Market, Enterprise, and SMB customer segments.
- Explore sales contribution by product category and brand.
- Filter performance by date and region to focus analysis on specific markets and periods.
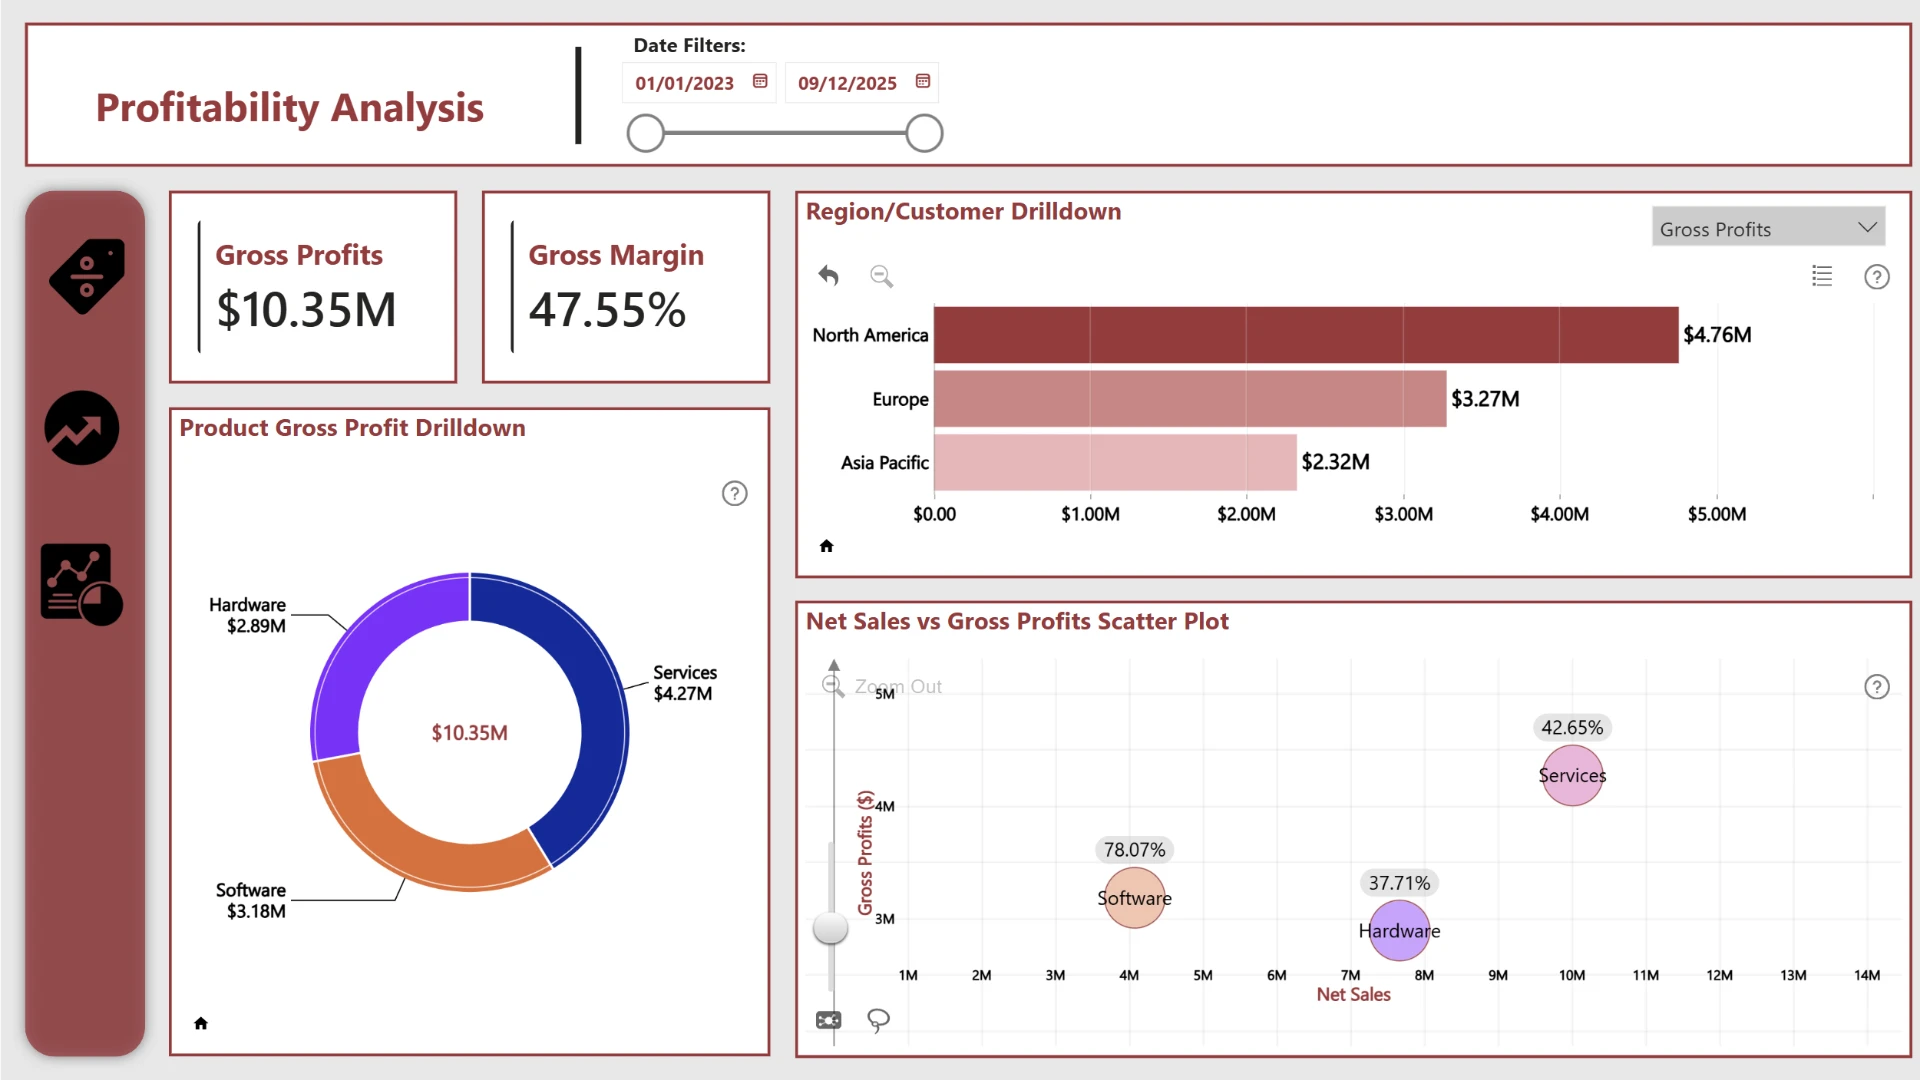
Profitability Analysis
The Profitability Analysis page focuses on Gross Profit, Gross Margin, regional profitability, and product-level profit performance.
- Track overall Gross Profits and Gross Margin.
- Compare Gross Profit across North America, Europe, and Asia Pacific.
- Drill into regional performance to analyze customer-level profitability.
- Break down Gross Profit across Services, Software, and Hardware.
- Compare Net Sales and Gross Profit to understand the relationship between revenue scale and margin performance.
- Identify categories with different profitability profiles using Gross Margin %.
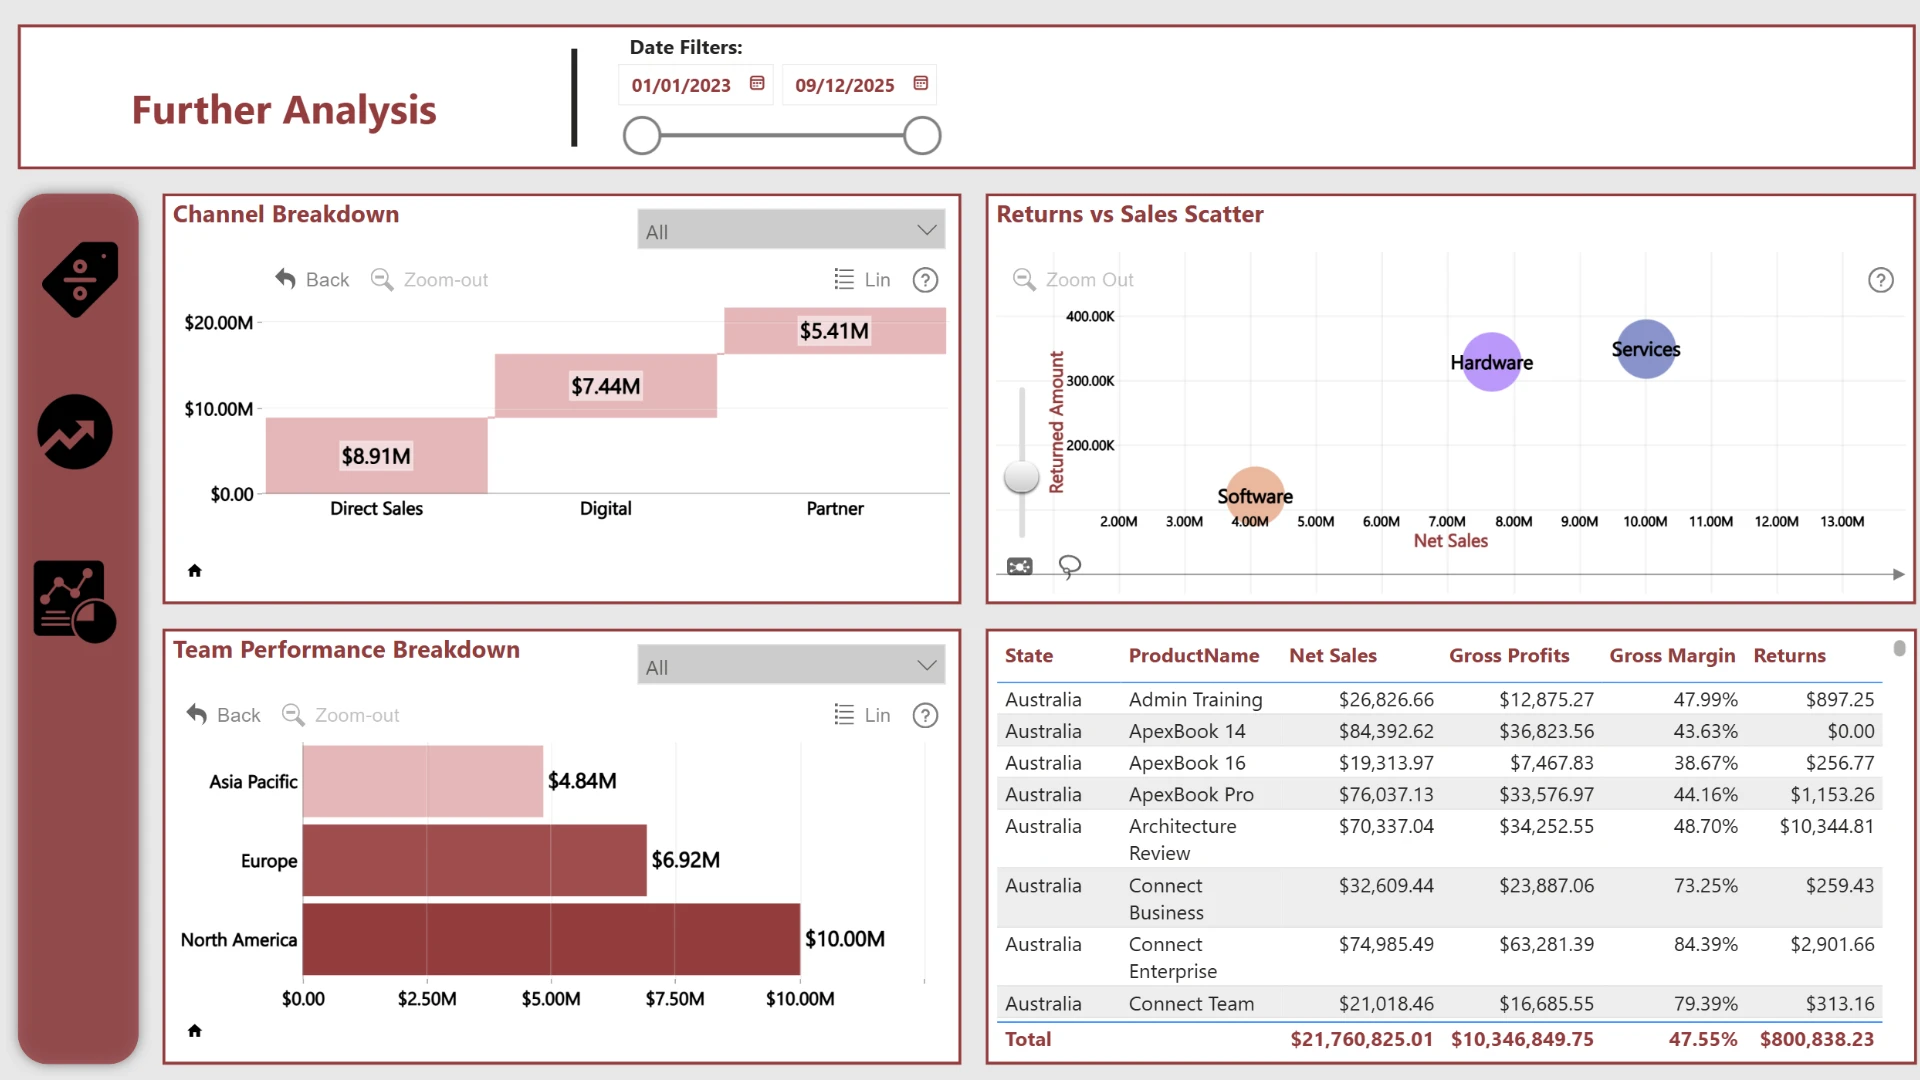
Further Analysis
The Further Analysis page provides additional detail on sales channels, regional teams, product returns, and individual product performance.
- Compare sales contribution across Direct Sales, Digital, and Partner channels.
- Analyze team performance across North America, Europe, and Asia Pacific.
- Compare Net Sales and Returned Amount across Software, Hardware, and Services.
- Identify categories where high sales are accompanied by comparatively high returns.
- Review detailed product performance using Net Sales, Gross Profits, Gross Margin, and Returns.
- Filter the report by date to investigate specific periods and changes in performance.
Target and Variance Analysis
A central focus of the report is understanding the relationship between actual sales performance and expected targets.
- Monitor overall progress toward the sales target using a clear achievement percentage.
- Compare sales performance across regions to identify where target gaps originate.
- Analyze sales by customer segment to understand which groups contribute most to target achievement.
- Explore product categories and brands to identify the strongest contributors to overall sales.
- Use time-based analysis to see whether sales performance is improving or weakening across years.
Interactive Exploration
Built with interactive Power BI visuals, the dashboard allows users to move from high-level KPIs into detailed regional, customer, product, and channel analysis.
- Filter analysis by date range and region.
- Drill from region into customer-level performance.
- Explore product performance across categories, brands, and individual products.
- Compare sales and profitability across multiple dimensions without leaving the report.
- Investigate returns alongside sales to identify potential quality or operational issues.
ZoomCharts visuals used






4U Report Challenges
Participate in data challenges, build and submit reports to get free template downloads.
Join CommunityMobile view allows you to interact with the report. To Download the template please switch to desktop view.
How to use a PBIX template
Preview the interactive report, download the PBIX file, open it in Power BI Desktop, and replace the same data connection with your own dataset.
Preview and download
Explore the report online and download the PBIX template file.
Open in Power BI Desktop
Open the downloaded PBIX file in Power BI Desktop.
Connect your data
Replace the sample data source with your own dataset.
Refresh and adjust
Refresh the model and update fields or visual were needed.
Save and share
Save your report and publish it for your audience.


