logo
For Power BI Report Templates
  • Products

    Drill Down Visuals for Power BI

    Discover the most customizable custom visuals for Power BI.

    Pricing & licensing
    • Drill Down Donut Pro
      Drill Down Donut Category Composition
    • Drill Down Pie Pro
      Drill Down Pie Proportional Breakdown
    • Drill Down Combo Pro
      Drill Down Combo Multi-Metric Trends
    • Drill Down Combo Bar Pro
      Drill Down Combo Bar Cross-Metric Trends
    • Drill Down Line Pro
      Drill Down Line Trend Analysis
    • Drill Down Bubble Pro
      Drill Down Bubble Value Relationships
    • Drill Down Scatter Pro
      Drill Down Scatter Correlation Analysis
    • Drill Down Network Pro
      Drill Down Network Entity Connections
    • Drill Down Graph Pro
      Drill Down Graph Relationship Mapping
    • Drill Down Map Pro
      Drill Down Map Geographic Insights
    • Drill Down Waterfall Pro
      Drill Down Waterfall Change Breakdown
    • Drill Down Timeline Pro
      Drill Down Timeline Time-Based Metrics
    • Drill Down TimeSeries Pro
      Drill Down TimeSeries Temporal Patterns
    • Drill Down Line Pro
      Drill Down Line Trend Analysis

    Visuals in Planning

    Discover visuals we’re exploring, share your feedback, and help us decide what to build next.

    Browse concepts
  • Template Reports
    • Browse Report Templates
      Browse Report Templates Explore 2000+
      Power BI reports
    • Pricing Report Templates
      unlimited access

    Explore Report Templates

    Industry

    • Logistics
    • Education
    • Healthcare
    • Transportation
    • Banking
    • Ecommerce
    • Crime analytics
    • Retail
    • Manufacturing

    Business Domain

    • Sales
    • Marketing
    • Accounting & Finance
    • Human Resources
    • Research
    • Project Management
    • CRM
    • Support
    • Customer experience
  • Resources

      Learn

    • Video Tutorials Step-by-step Power BI guides
    • Webinars Live and recorded expert sessions
    • Visuals Gallery Explore all custom Power BI visuals
    • Blog Power BI tips, updates, and guides
    • Documentation Setup, features, and API reference

    Support

    • ZoomCharts Assistance Help from our product experts
    • Contact Sales Questions about pricing or licensing
    • Contact Support Technical help and troubleshooting
    • FAQ Quick answers to common questions
  • Services
    • Power BI Report Development
      Power BI Report Development End-to-end custom
      Power BI reports.
    • Custom Visual Development
      Custom Visual Development Custom visuals for
      your business needs.
  • Challenges
  • Pricing
Get started
Get started
Get it now
Go back

Contents

Dashboard and report examples Power BI Project Management Dashboard Example for Fintech
Go back

2378

Power BI Project Management Dashboard Example for Fintech

Power BI Project Management Dashboard Example for Fintech

Report
Report
Report
Report

More Report pages

Report
Report
Report
Report
Report Interact

Report Author: Agbata Dickson Ukolojo

2378

Combo Bar Timeline Donut Information Technology Banking

Share template with others

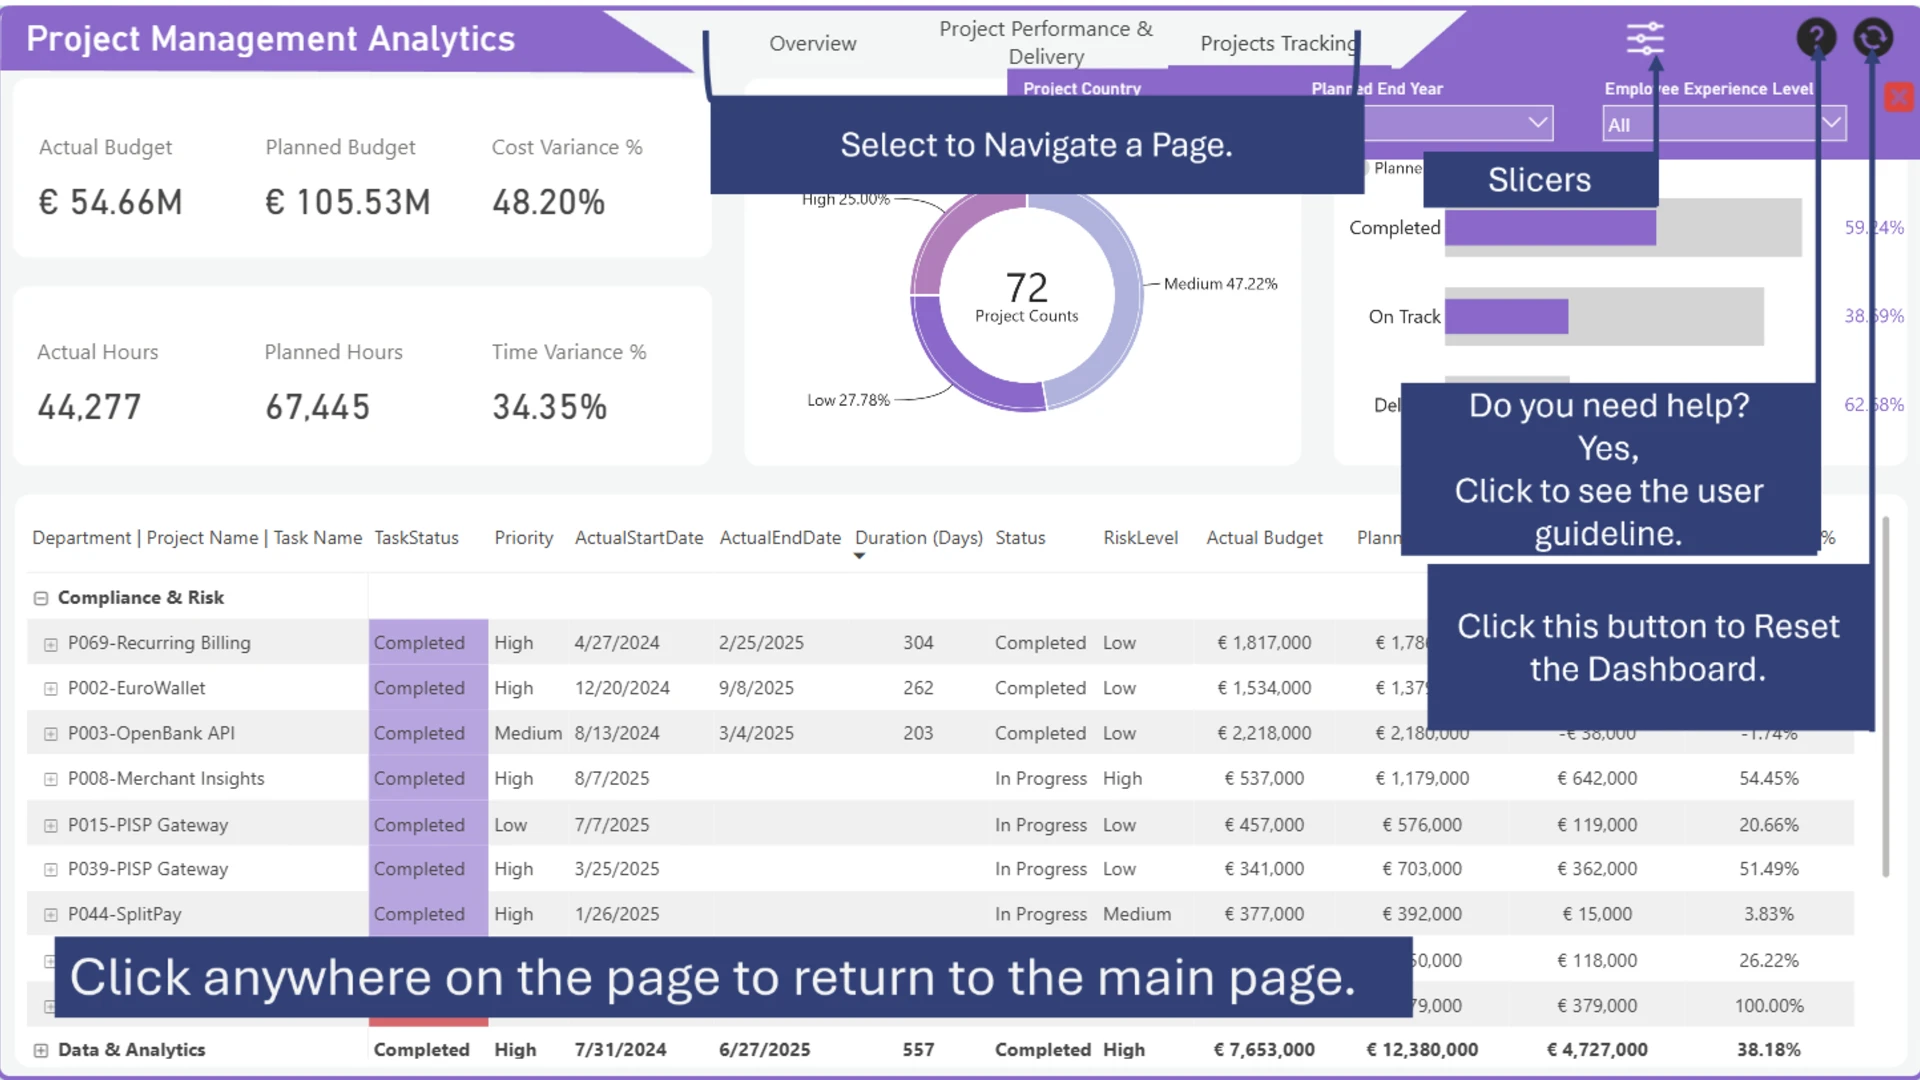
This Power BI project management dashboard uses the Fintech Project Management dataset. It was submitted to the FP20 Analytics ZoomCharts Data Challenge 32 in November 2025.

The report helps analyze project performance, delivery efficiency, budget variance, time variance, task status, and risk levels across fintech departments and projects. It is designed for project managers, PMO teams, analysts, and executives who need an interactive project tracking dashboard to monitor budgets, timelines, workloads, and delivery outcomes.

Key insights of this report

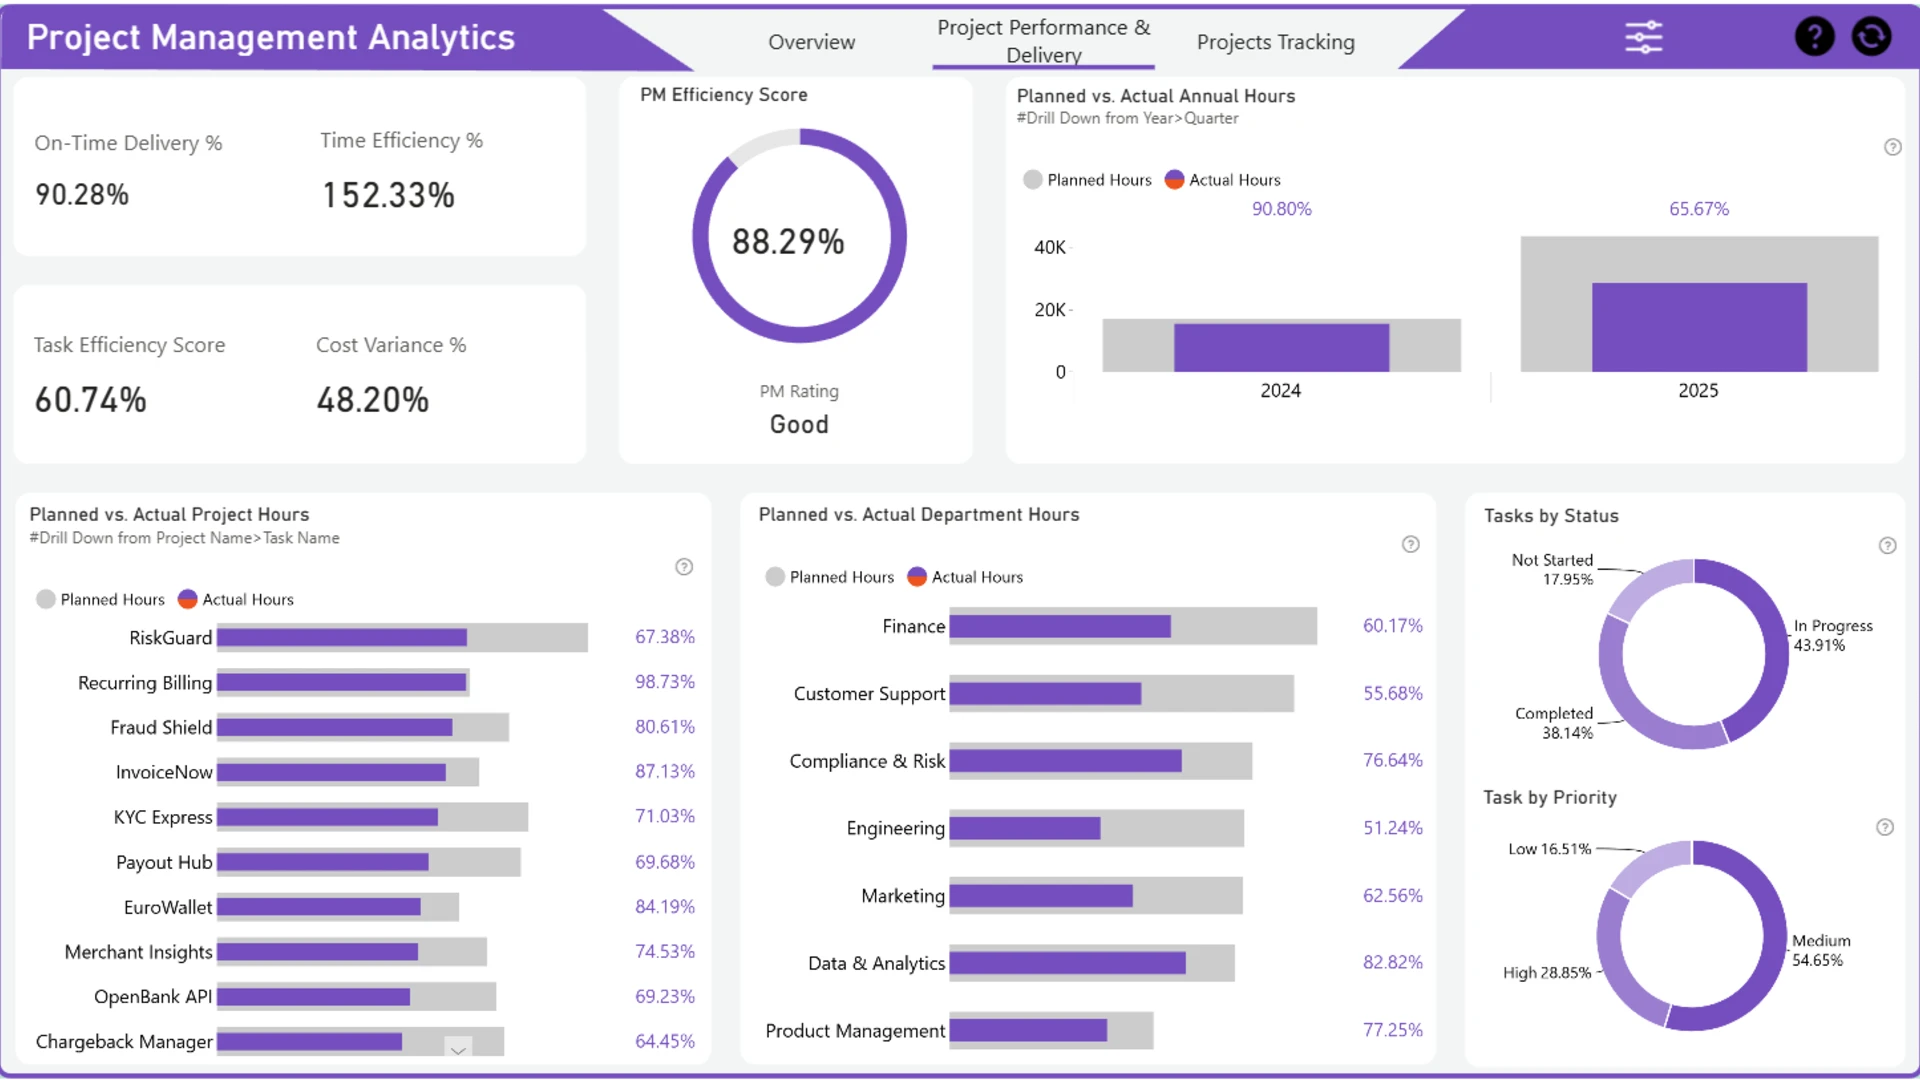
This Power BI project management dashboard gives you a clear view of important project KPIs, including:

  • Actual budget and planned budget
  • Cost variance and cost variance %
  • Actual hours and planned hours
  • Time variance %
  • On-time delivery %
  • PM efficiency score
  • Task efficiency score
  • Project count by risk level
  • Tasks by status
  • Tasks by priority
  • Planned vs. actual project hours
  • Planned vs. actual department hours
  • Planned vs. actual budget by project status

These metrics make it easier to spot budget overruns, delayed work, high-risk projects, and resource planning gaps.

Interactive dashboard features

This report uses a combination of ZoomCharts Drill Down PRO visuals and native Power BI visuals, making it easy to explore the data directly from the charts.

You can:
  • Click on charts and table elements to filter the report
  • Drill down from risk level to priority
  • Drill down from year to quarter
  • Drill down from project name to task name
  • Use slicers to filter the data by project country, planned end year, and employee experience level
  • Reset the dashboard with one click
  • Switch between report pages using the navigation menu
  • Open the user guideline from the help button

Instead of only viewing static charts, you can interact with the report and explore the story behind the numbers.

How to use this report template

To interact with this Power BI project management dashboard, click any active element directly on the visuals. Use the navigation menu to switch between the overview, delivery performance, and project tracking pages.

Download this Power BI report template to explore the visuals, formulas, calculations, drill-down settings, and dashboard design. You can adapt it to your own project management, PMO, fintech, operations, or delivery tracking data with a few adjustments.

ZoomCharts visuals used

Drill Down Combo Bar PRO Drill Down Combo Bar PRO
Drill Down Timeline PRO Drill Down Timeline PRO
Drill Down Donut PRO Drill Down Donut PRO

4U Report Challenges

Participate in data challenges, build and submit reports to get free template downloads.

Join Community

Mobile view allows you to interact with the report. To Download the template please switch to desktop view.

Similar reports

All Reports 2783 results
New
Report Card

Power BI Banking Dashboard by Okeh Dono Efasa

68229

New
Report Card

Power BI Financial Analysis Dashboard by Iris Mejuto Crego

148460

New
Report Card

Power BI Service Desk Dashboard by Iris Mejuto Crego

188148

Explore all reports

Was this helpful? Thank you for your feedback!

Sorry about that.

How can we improve it?

Power BI Project Management Dashboard Example for Fintech

Report Author: Agbata Dickson Ukolojo

2378

ZoomCharts

Welcome to ZoomCharts

You’re almost there! Create an account to download reports.

or
Sign up with Microsoft

Verify your email address

We have sent a code to your email address. Please input the code below.

Didn't receive code? Request again (after 30 seconds)

Already have an account? Log in

ZoomCharts

Log in to your ZoomCharts account

Log in with Microsoft
or
Forgot password?

Reset your password

We'll email you instructions on how to reset your password

Don't have an account? Sign up

Please add credits

You have 0 available downloads.
Get more credits or upgrade your plan to continue.

View pricing
logo
[email protected]
+44 204 577 3993
logo

Products

Drill Down Bubble PRO Drill Down Line PRO Drill Down Network PRO Drill Down Waterfall PRO Drill Down Graph PRO Drill Down Combo PRO Drill Down Combo Bar PRO Drill Down Donut PRO Drill Down Pie PRO Drill Down TimeSeries PRO Drill Down Timeline PRO Drill Down Map PRO Drill Down Scatter PRO All Visuals

Resources

Report Examples Webinars Blog ZoomCharts Academy Visuals Gallery Documentation Custom Visual Development Subscribe to News

Solutions

Custom Visual Development

Company

Pricing About Us Partners Leave feedback Join PowerGroup EU Funding

Help

ZoomCharts Assistance Contact Sales Contact Support FAQ AI Information

Drill Down Line PRO Drill Down Bubble PRO Drill Down Network PRO Drill Down Waterfall PRO Drill Down Graph PRO Drill Down Combo PRO Drill Down Combo Bar PRO Drill Down Donut PRO Drill Down Pie PRO Drill Down TimeSeries PRO Drill Down Timeline PRO Drill Down Map PRO Drill Down Scatter PRO All Visuals

Report Examples Webinars Blog ZoomCharts Academy Visuals Gallery Documentation Custom Visual Development Subscribe to News

Custom Visual Development

Pricing About Us Partners Leave feedback Join PowerGroup EU Funding

ZoomCharts Assistance Contact Sales Contact Support FAQ AI Information
+44 204 577 3993
[email protected]

Ready to get in touch?

Contact our experts with any question about Power BI and ZoomCharts for Free!

Contact us

© 2026, Data Visualization Software Lab

U.S. Patents No. 11,645,343; 11,921,804; 12,346,389

Cookies
Privacy Policy
Global
Legal
Patent
warning

Error message

success

Success info: Done!

ZoomCharts AI Assistant

We noticed you're using an old OS version.

For the best experience, we recommend upgrading to ensure that all website features display correctly.

Cookie settings

We use necessary cookies for site functionality, as well as statistic, marketing, and preference cookies to enhance your experience. For more information and to manage your preferences, please visit our Cookie policy