1103
Power BI Procurement Performance Report
Power BI Procurement Performance Report
More Report pages
Report Author: Fathiat (Abimbola) Odutayo
1103
Share template with others
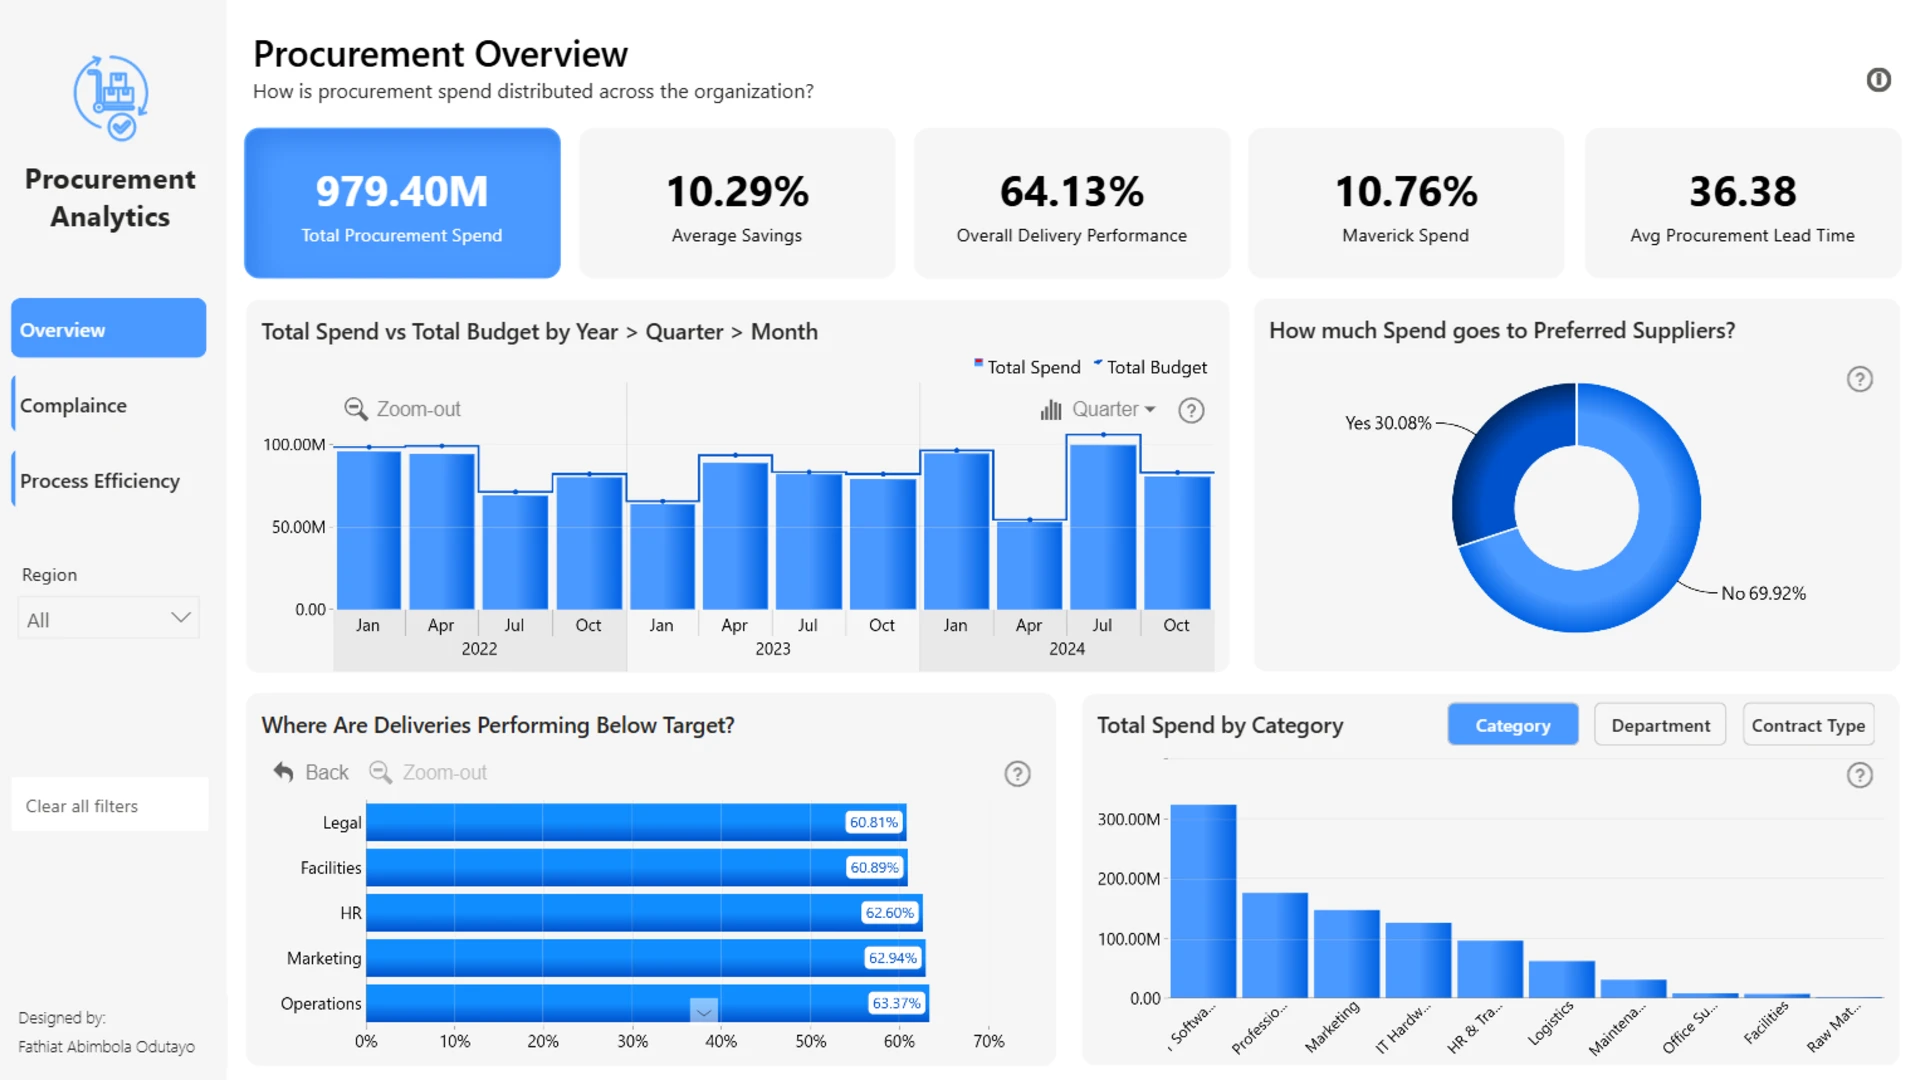
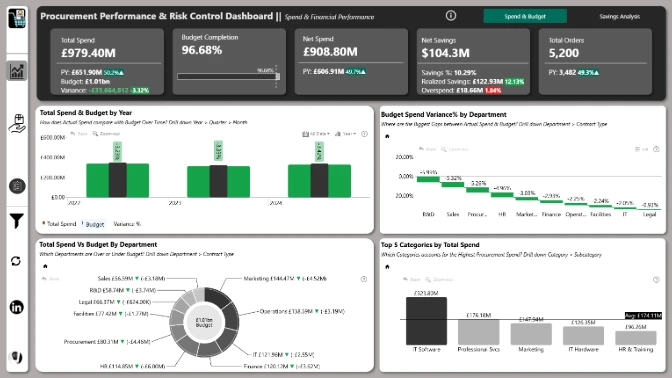
This interactive Power BI report explores the Procurement dataset using ZoomCharts Drill Down custom visuals and native Power BI visuals. It analyzes purchase order activity from 2022 to 2024, highlighting procurement spend, supplier performance, budget versus actuals, savings, delivery timelines, supplier risk, and maverick spend across categories, departments, regions, and suppliers.
The report helps users identify spending trends, compare supplier performance, monitor compliance, evaluate budget pressure, and uncover opportunities to improve procurement efficiency, reduce risk, and support better purchasing decisions.
The report was submitted to the FP20 Analytics ZoomCharts Data Challenge 37 (April-May 2026).
Author’s Description:
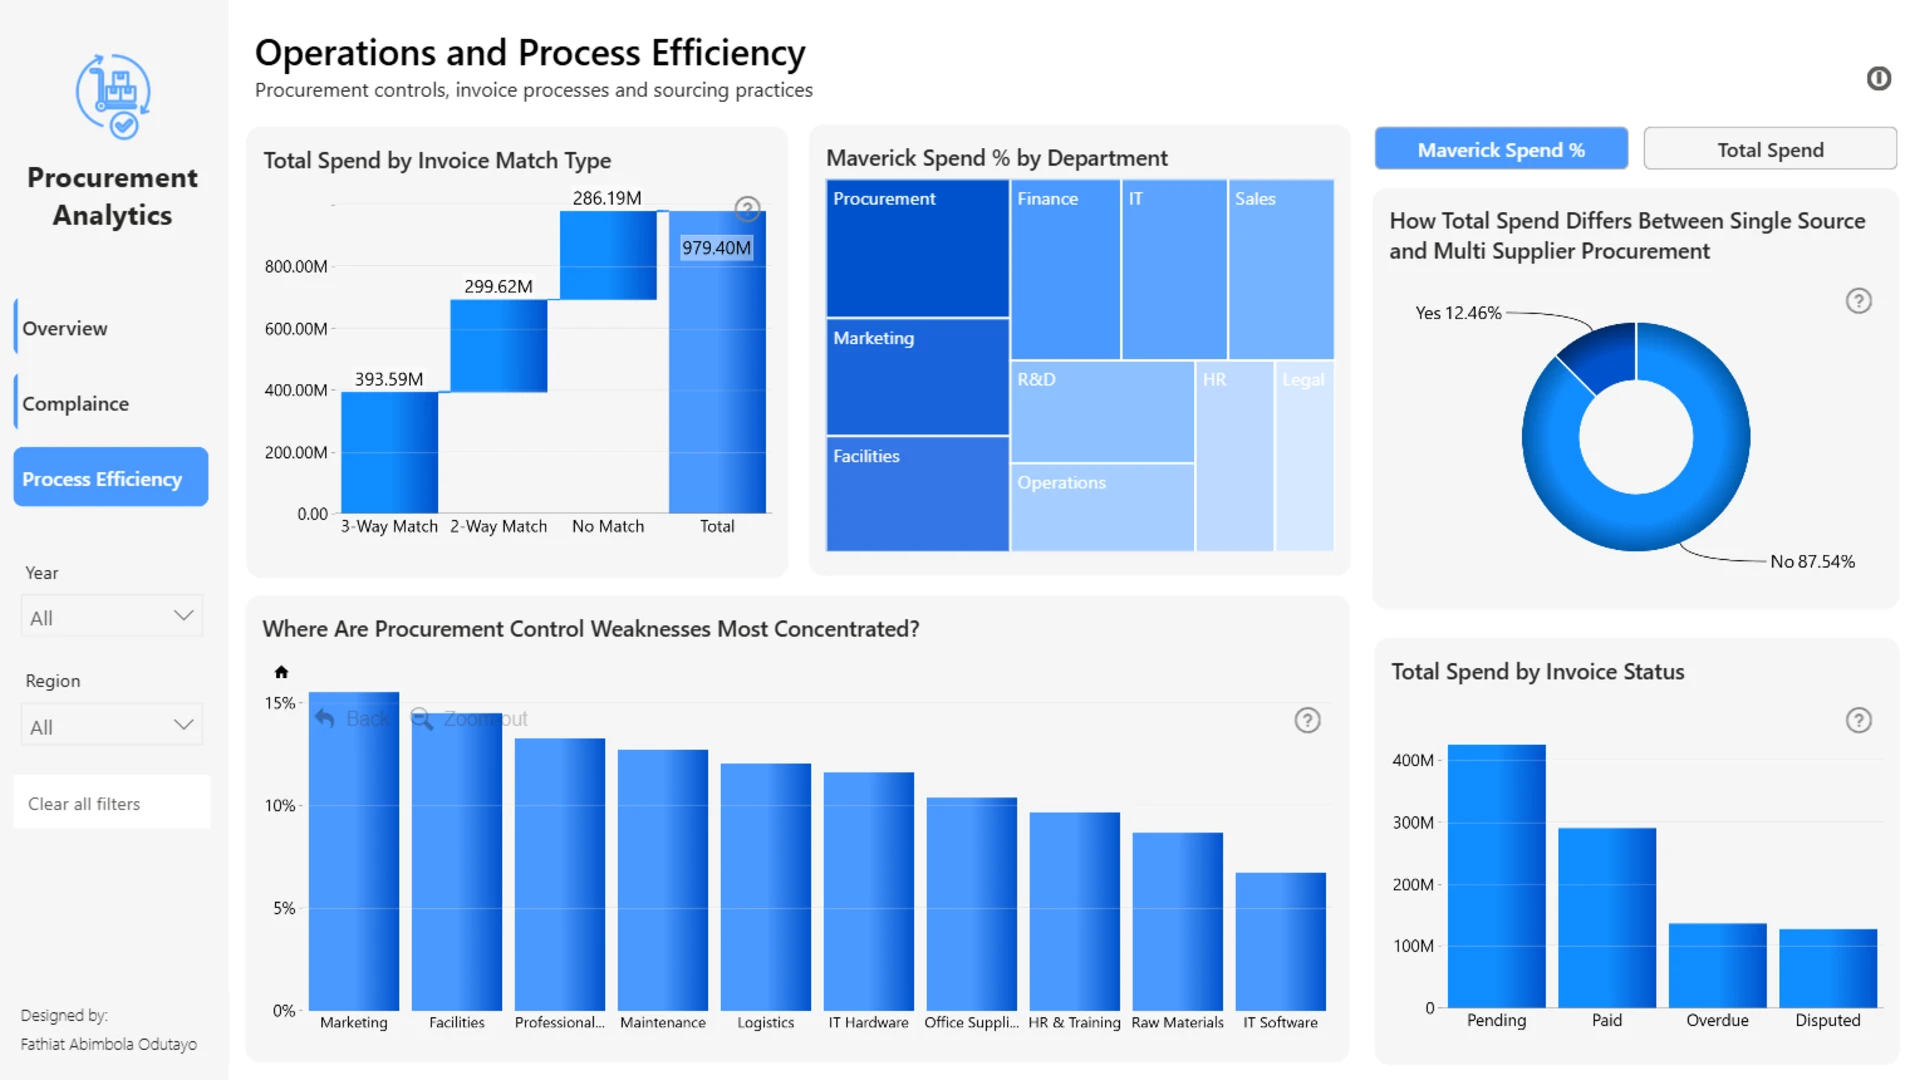
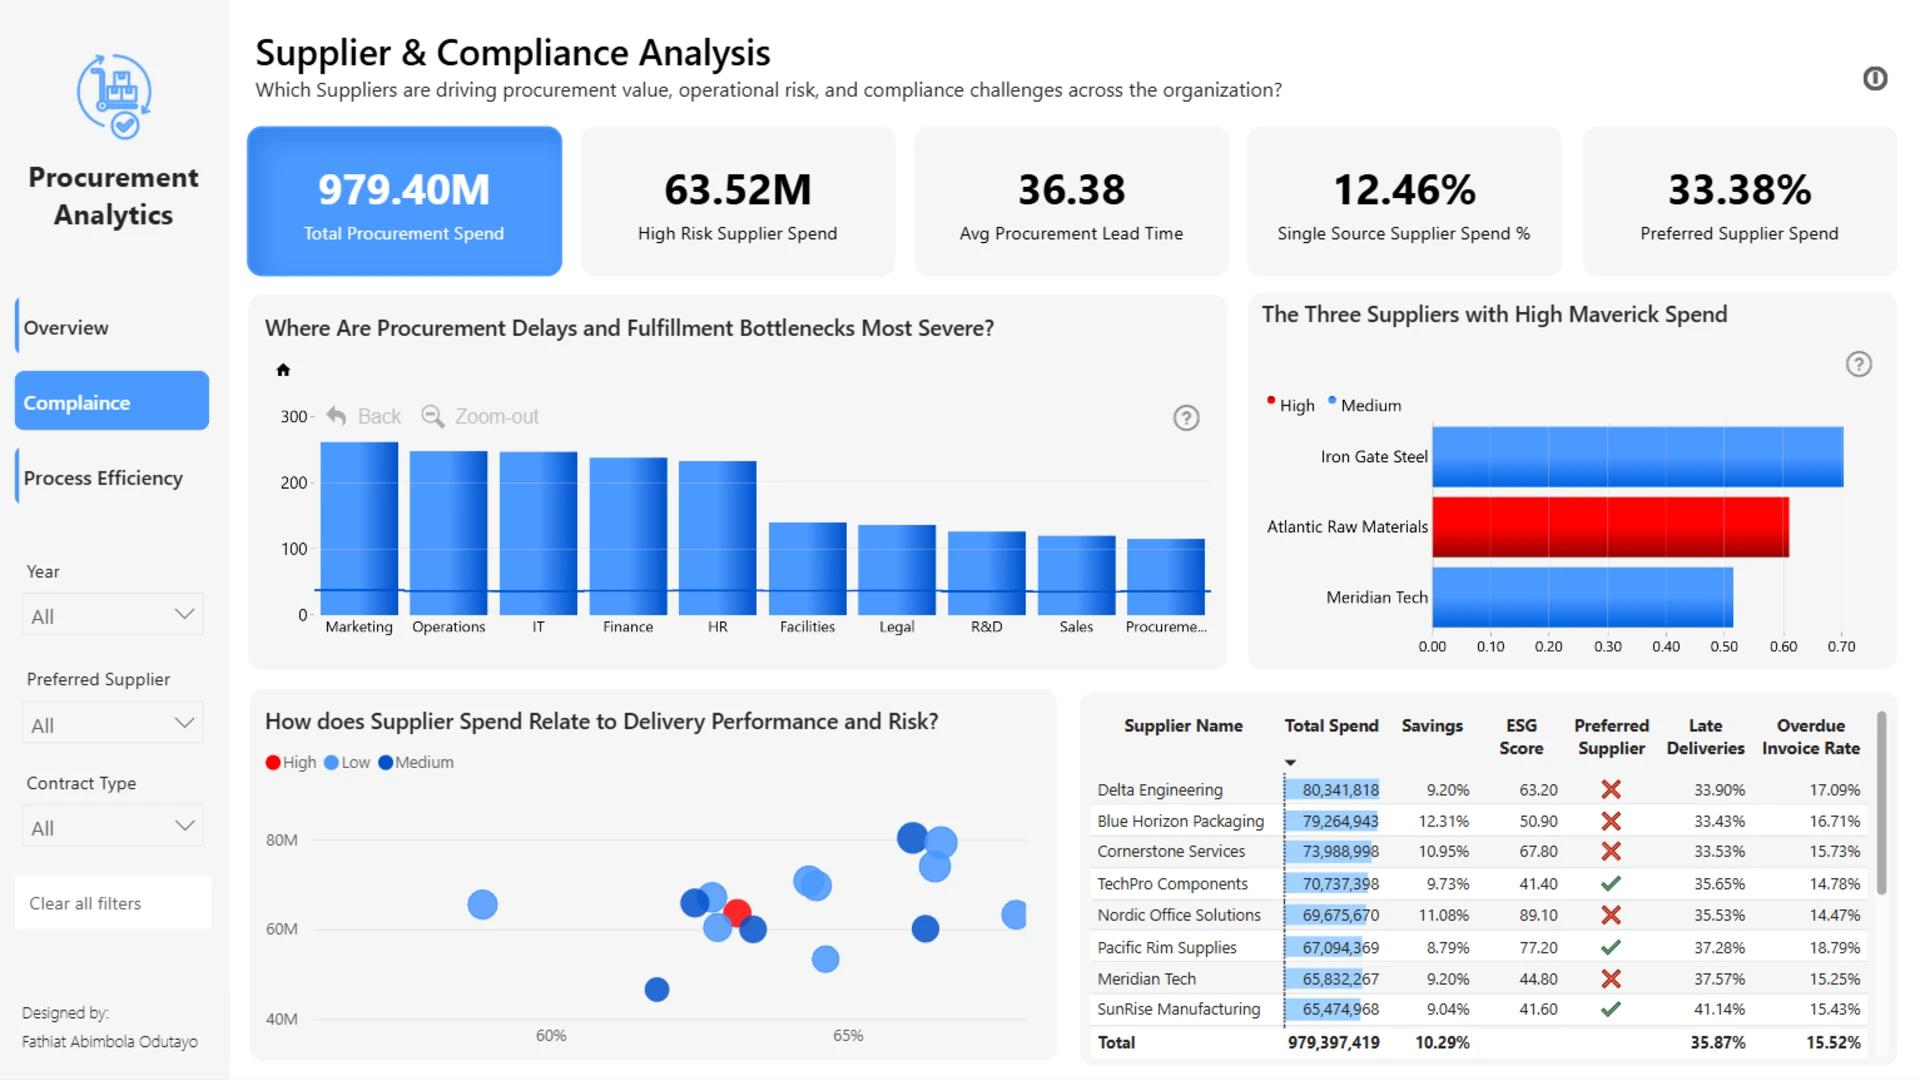
This report analyzes organizational procurement activity to uncover spending patterns, supplier performance, operational inefficiencies, and compliance risks across the procurement lifecycle. The dashboard explores how procurement spend is distributed across departments, categories, suppliers, and contract types while evaluating supplier reliability through delivery performance, lead times, invoice controls, risk exposure, and ESG indicators.
Key insights reveal a significant reliance on non-preferred suppliers and spot contracts, concentrated maverick spend among a small group of suppliers and departments, and a strong relationship between weak invoice controls and increased procurement non-compliance.
Interactive drill-down analysis, supplier drillthrough pages, custom tooltips, and cross-filtering capabilities allow users to investigate procurement behavior from high-level spend trends down to detailed supplier and process-level insights.
Built in Microsoft Power BI using ZoomCharts Drill Down Visuals to support multi-layer procurement exploration and an enhanced user experience.
ZoomCharts visuals used





4U Report Challenges
Participate in data challenges, build and submit reports to get free template downloads.
Join CommunityMobile view allows you to interact with the report. To Download the template please switch to desktop view.
How to use a PBIX template
Preview the interactive report, download the PBIX file, open it in Power BI Desktop, and replace the same data connection with your own dataset.
Preview and download
Explore the report online and download the PBIX template file.
Open in Power BI Desktop
Open the downloaded PBIX file in Power BI Desktop.
Connect your data
Replace the sample data source with your own dataset.
Refresh and adjust
Refresh the model and update fields or visual were needed.
Save and share
Save your report and publish it for your audience.


