1522
KPI Dashboard Example for Power BI Financial Performance
KPI Dashboard Example for Power BI Financial Performance
More Report pages
Report Author: Aakash M
1522
Share template with others
KPI Dashboard Example for Power BI Financial Performance
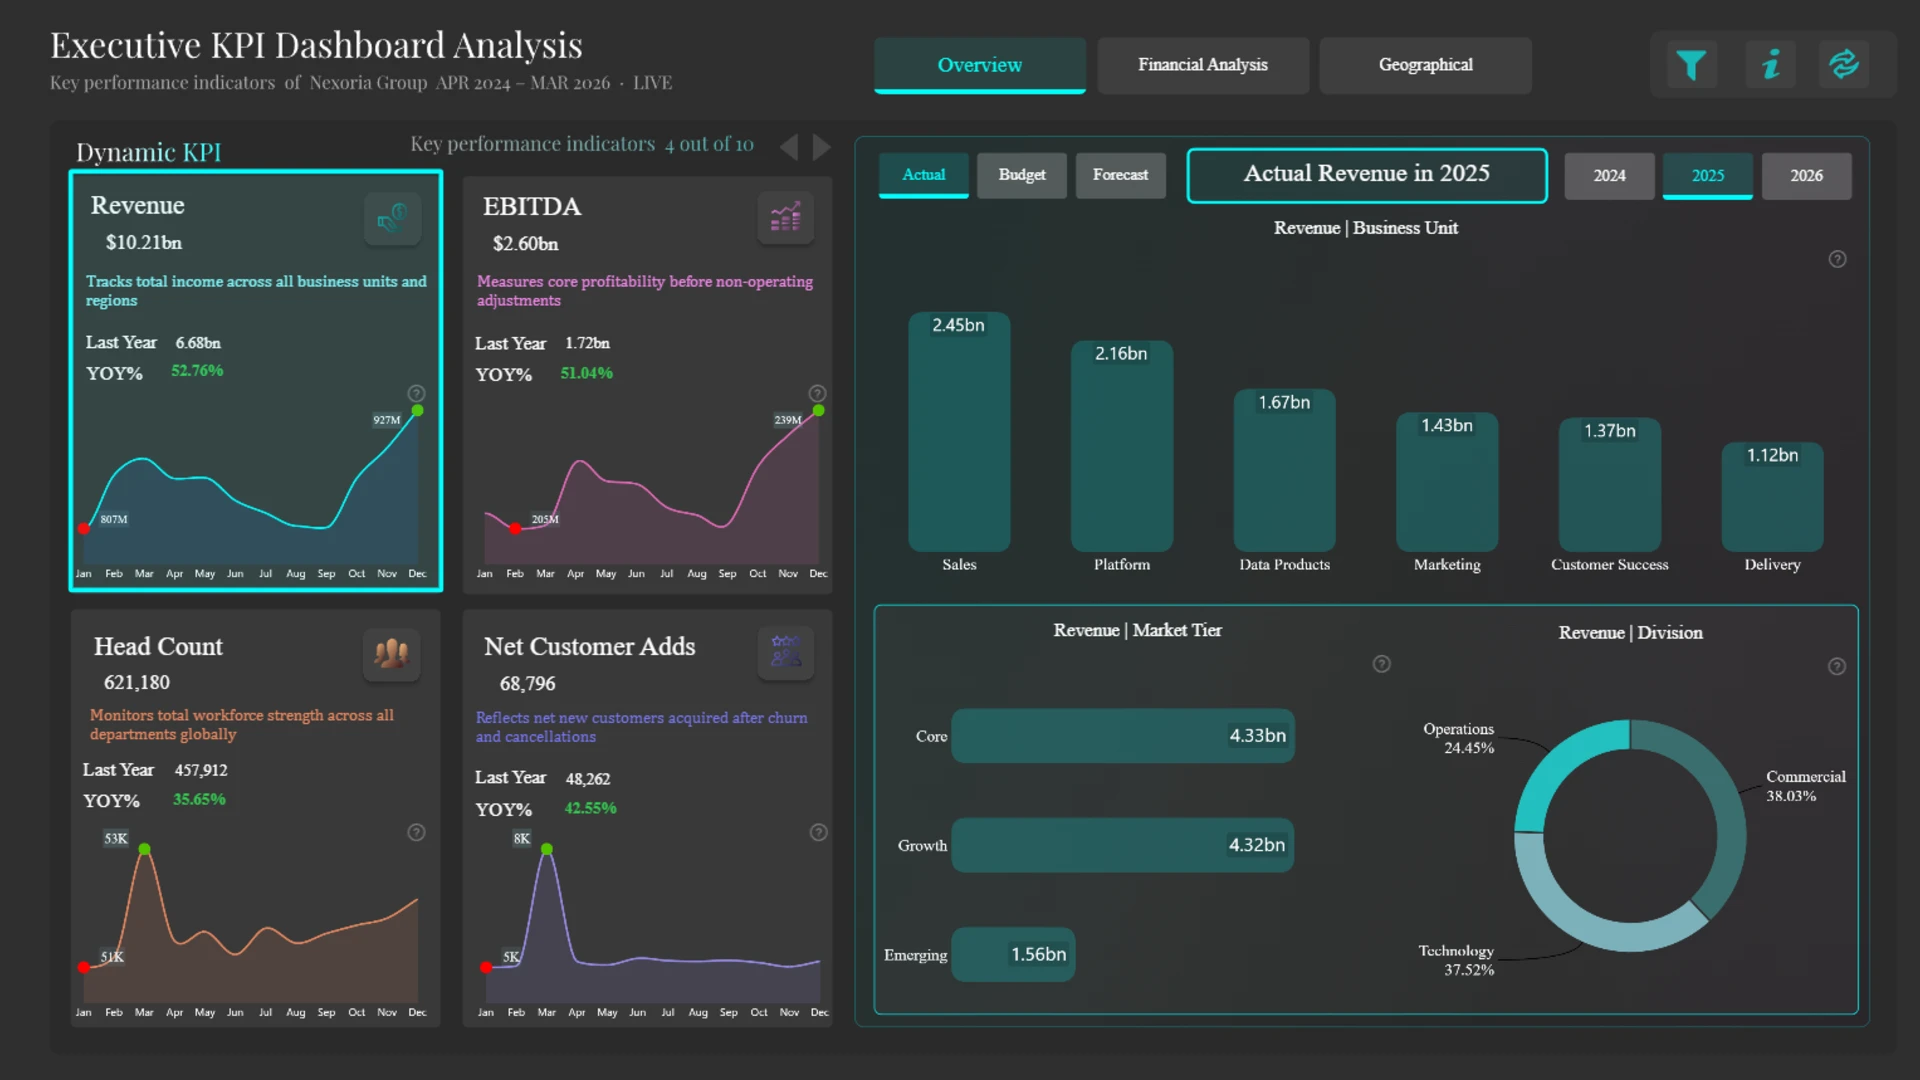
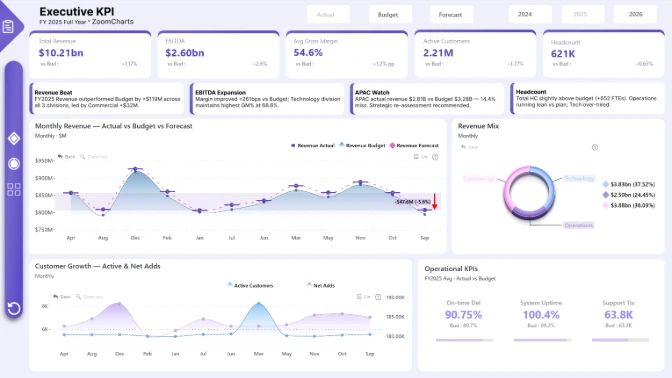
This KPI dashboard example shows how Power BI can be used to monitor Actual, Budget, and Forecast performance across the financial and operational metrics that matter most to executive teams.
Use this Power BI KPI dashboard example to track Revenue, EBITDA, Margin, Headcount, and Customer Growth while comparing actual results against budget and forecast targets.
This dashboard is designed for executives, finance teams, and business analysts who need a clear view of performance against plan. Instead of reviewing KPIs in separate reports, users can compare Actual, Budget, and Forecast values in one interactive Power BI report and quickly identify where results are ahead of or behind expectations.
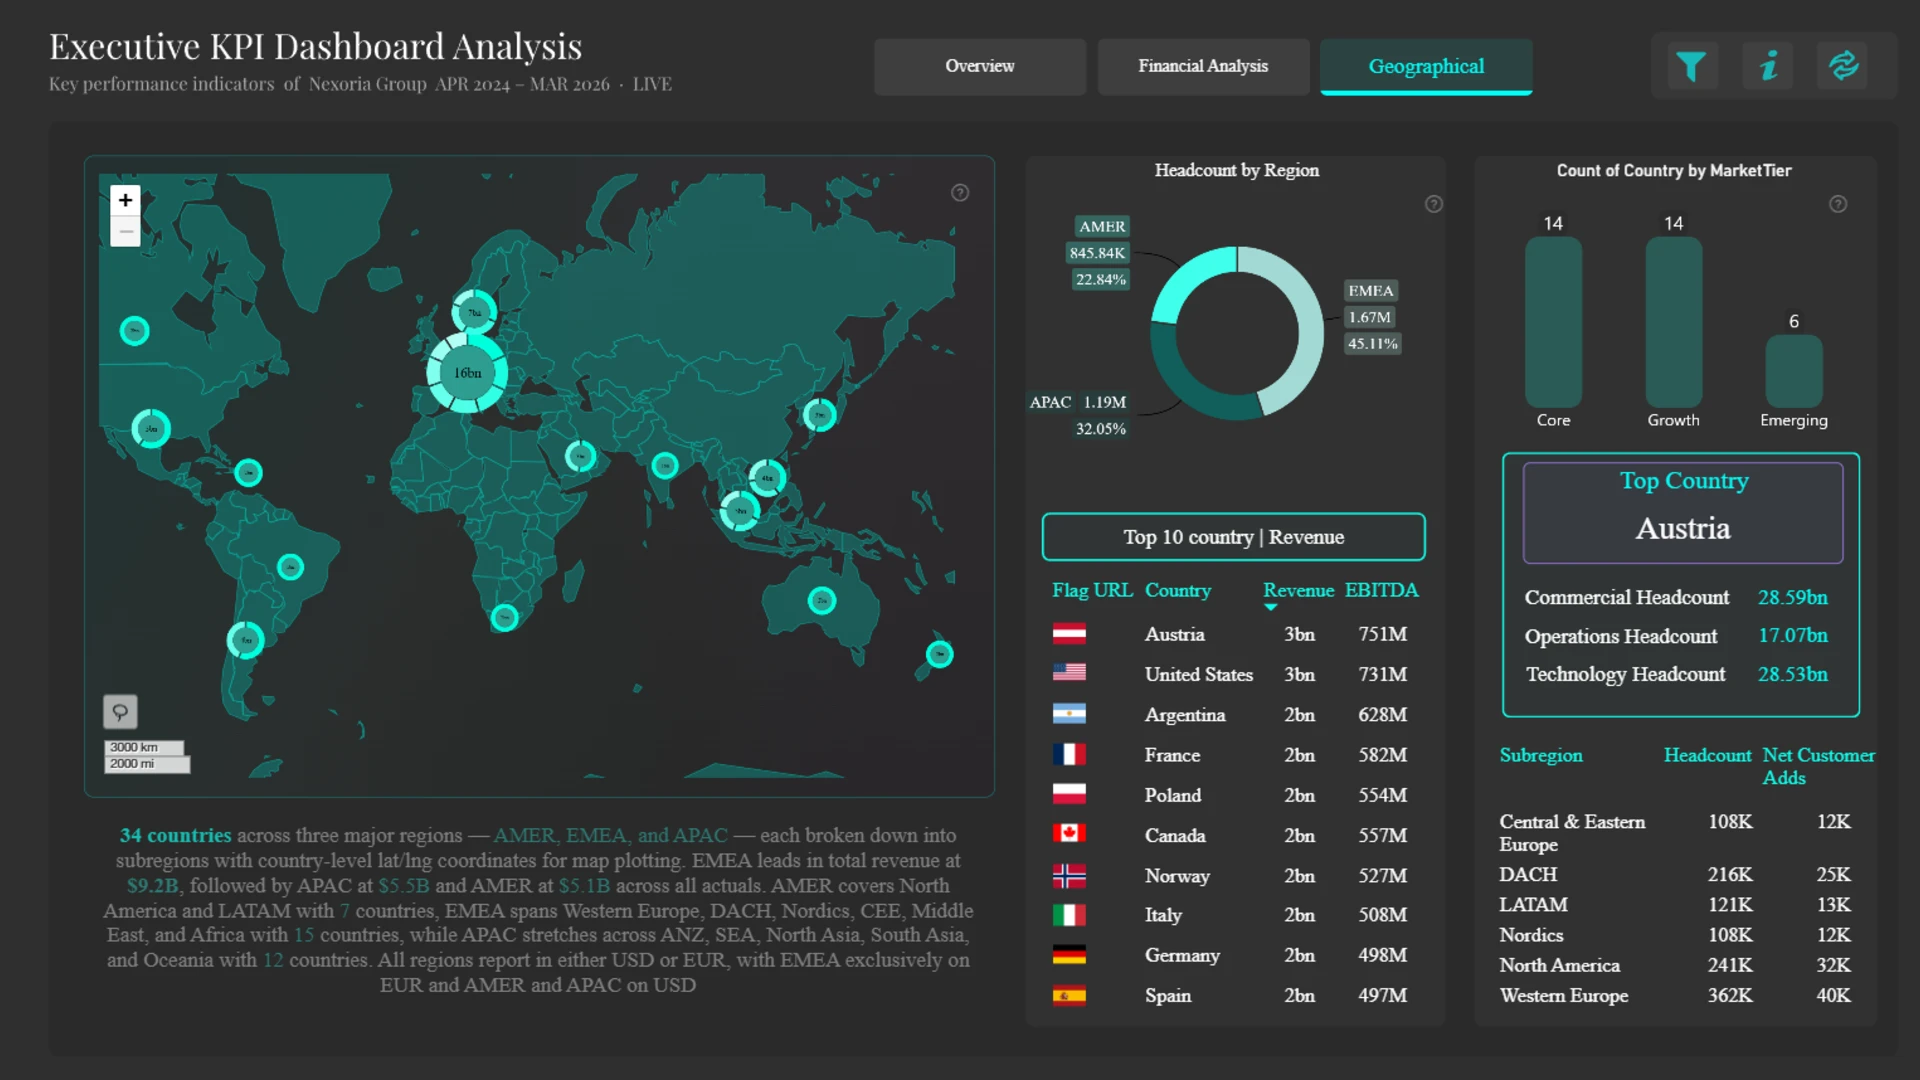
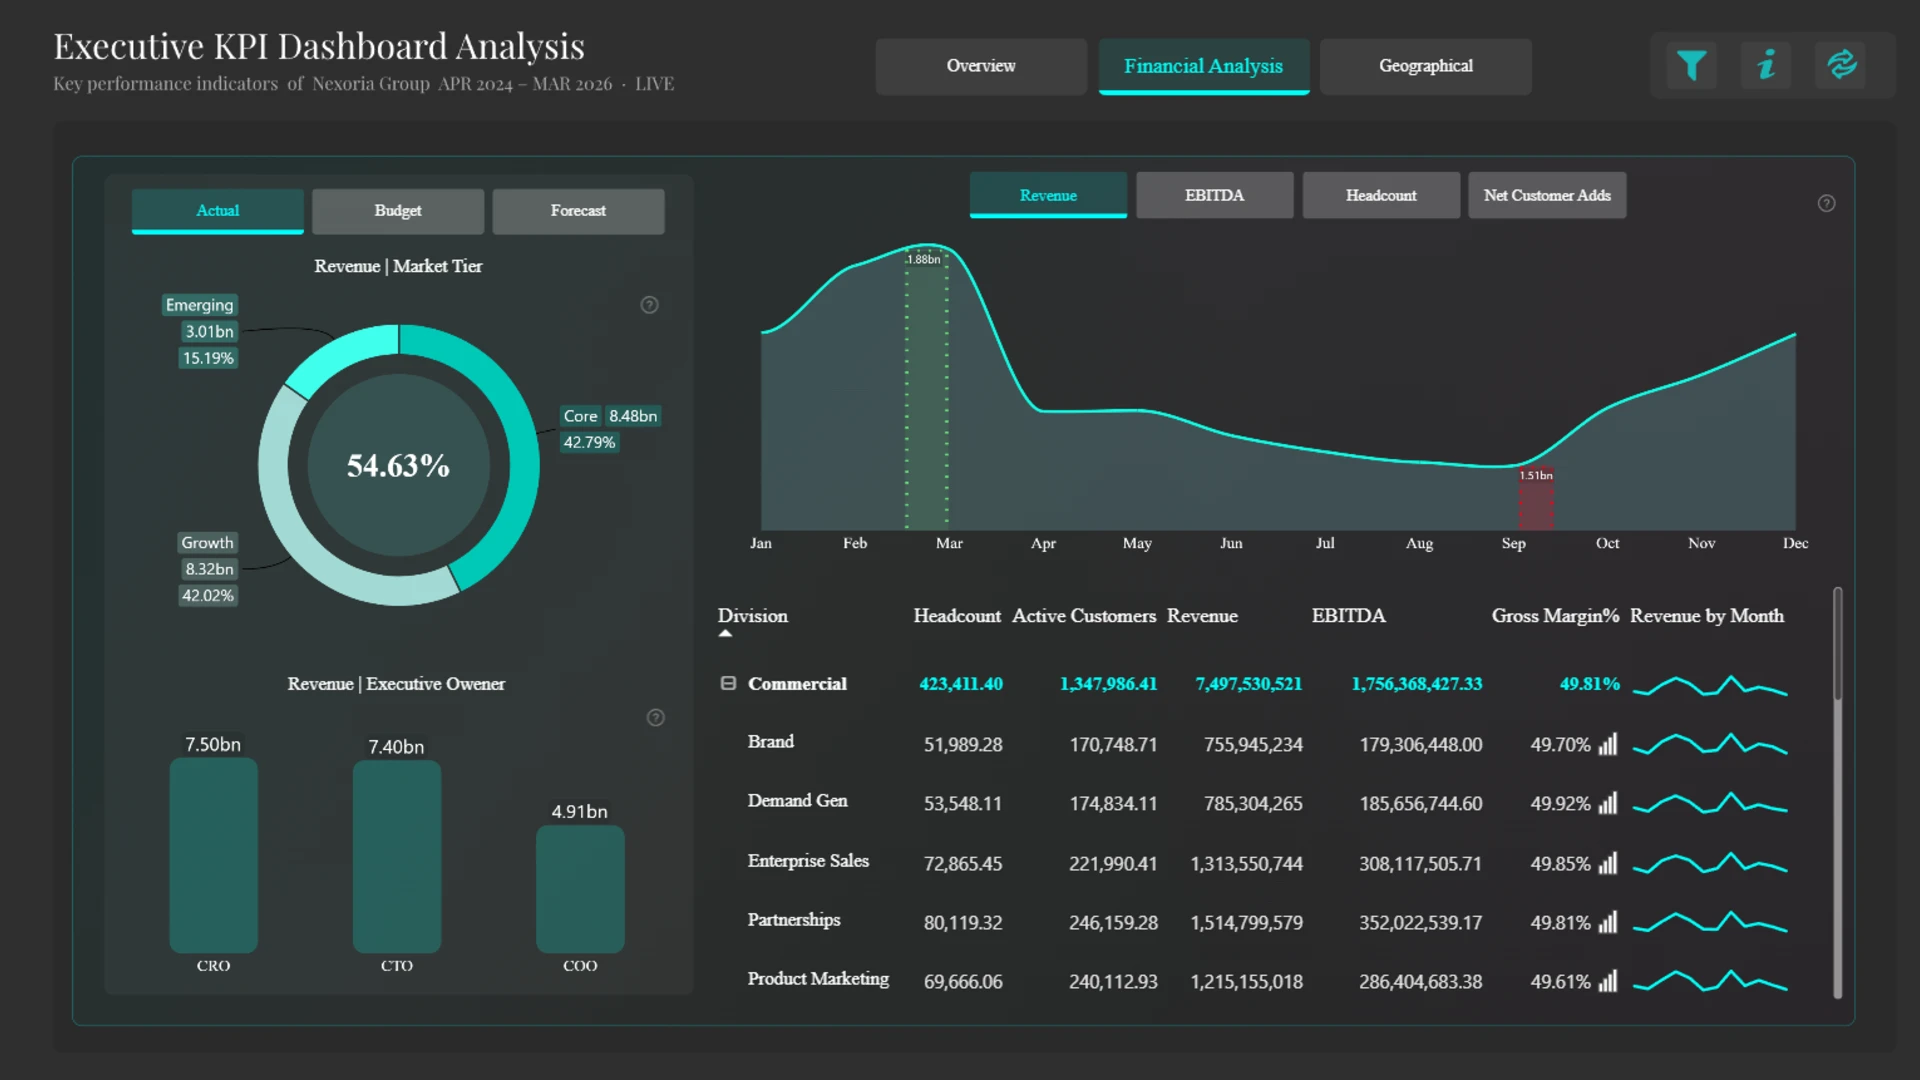
The report brings together financial and operational KPIs, making it useful as both a financial performance dashboard and an executive KPI dashboard example. With views for organizational structure and regional performance, it helps users move from high-level KPI monitoring to more detailed analysis of the business areas driving results.
Actual vs Budget vs Forecast
Compare current performance against planned and projected results to understand whether key business metrics are on track.
Executive KPI Tracking
Monitor Revenue, EBITDA, Margin, Headcount, and Customer Growth in a format built for fast leadership review.
Regional and Organizational Analysis
Review performance by region and organizational level to see where results differ across the business.
Standout Feature: KPI Variance Analysis in One View
The report’s main strength is its ability to combine KPI monitoring with variance analysis. Users can review headline performance metrics, compare them against budget and forecast values, and then drill into supporting views to understand where differences are coming from. This makes it a practical KPI dashboard example for teams that need both quick executive summaries and deeper financial analysis.
Build a KPI Dashboard Like This in Power BI
Use this report as a starting point for designing KPI dashboard examples that are clear, interactive, and focused on business performance. Customize the layout, metrics, and analysis views to match your own finance, operations, or executive reporting needs.
ZoomCharts visuals used




4U Report Challenges
Participate in data challenges, build and submit reports to get free template downloads.
Join CommunityMobile view allows you to interact with the report. To Download the template please switch to desktop view.
How to use a PBIX template
Preview the interactive report, download the PBIX file, open it in Power BI Desktop, and replace the same data connection with your own dataset.
Preview and download
Explore the report online and download the PBIX template file.
Open in Power BI Desktop
Open the downloaded PBIX file in Power BI Desktop.
Connect your data
Replace the sample data source with your own dataset.
Refresh and adjust
Refresh the model and update fields or visual were needed.
Save and share
Save your report and publish it for your audience.


