logo
For Power BI
  • Products
    • Custom Visuals for Power BI
    • Report Templates
  • Resources

      Resources

    • Documentation
    • Report Examples
    • Blog
    • Webinars
    • Video Tutorials
    • Visuals Gallery

    Support

    • ZoomCharts Assistance
    • Contact Sales
    • Contact Support
    • FAQ

    Challenges

    Challenges

    Improve your report creation skills by participating in free challenges for report creators.

    Learn more
    Get Developer License
  • Services
    • Power BI Report Development
    • Custom Visual Development
  • Challenges
  • Pricing
    • Custom Visuals for Power BI
    • Report Templates
Subscribe
Subscribe
Get it now
Go back

Contents

Contest logo
Contest logo
Contest logo
Contest logo
Try Free Now
Go back

29779

Power BI Email Communication Analysis Report by Toyin Taiwo

Report
Report Interact

Timeline Graph Human Resources

Share template with others

Summary

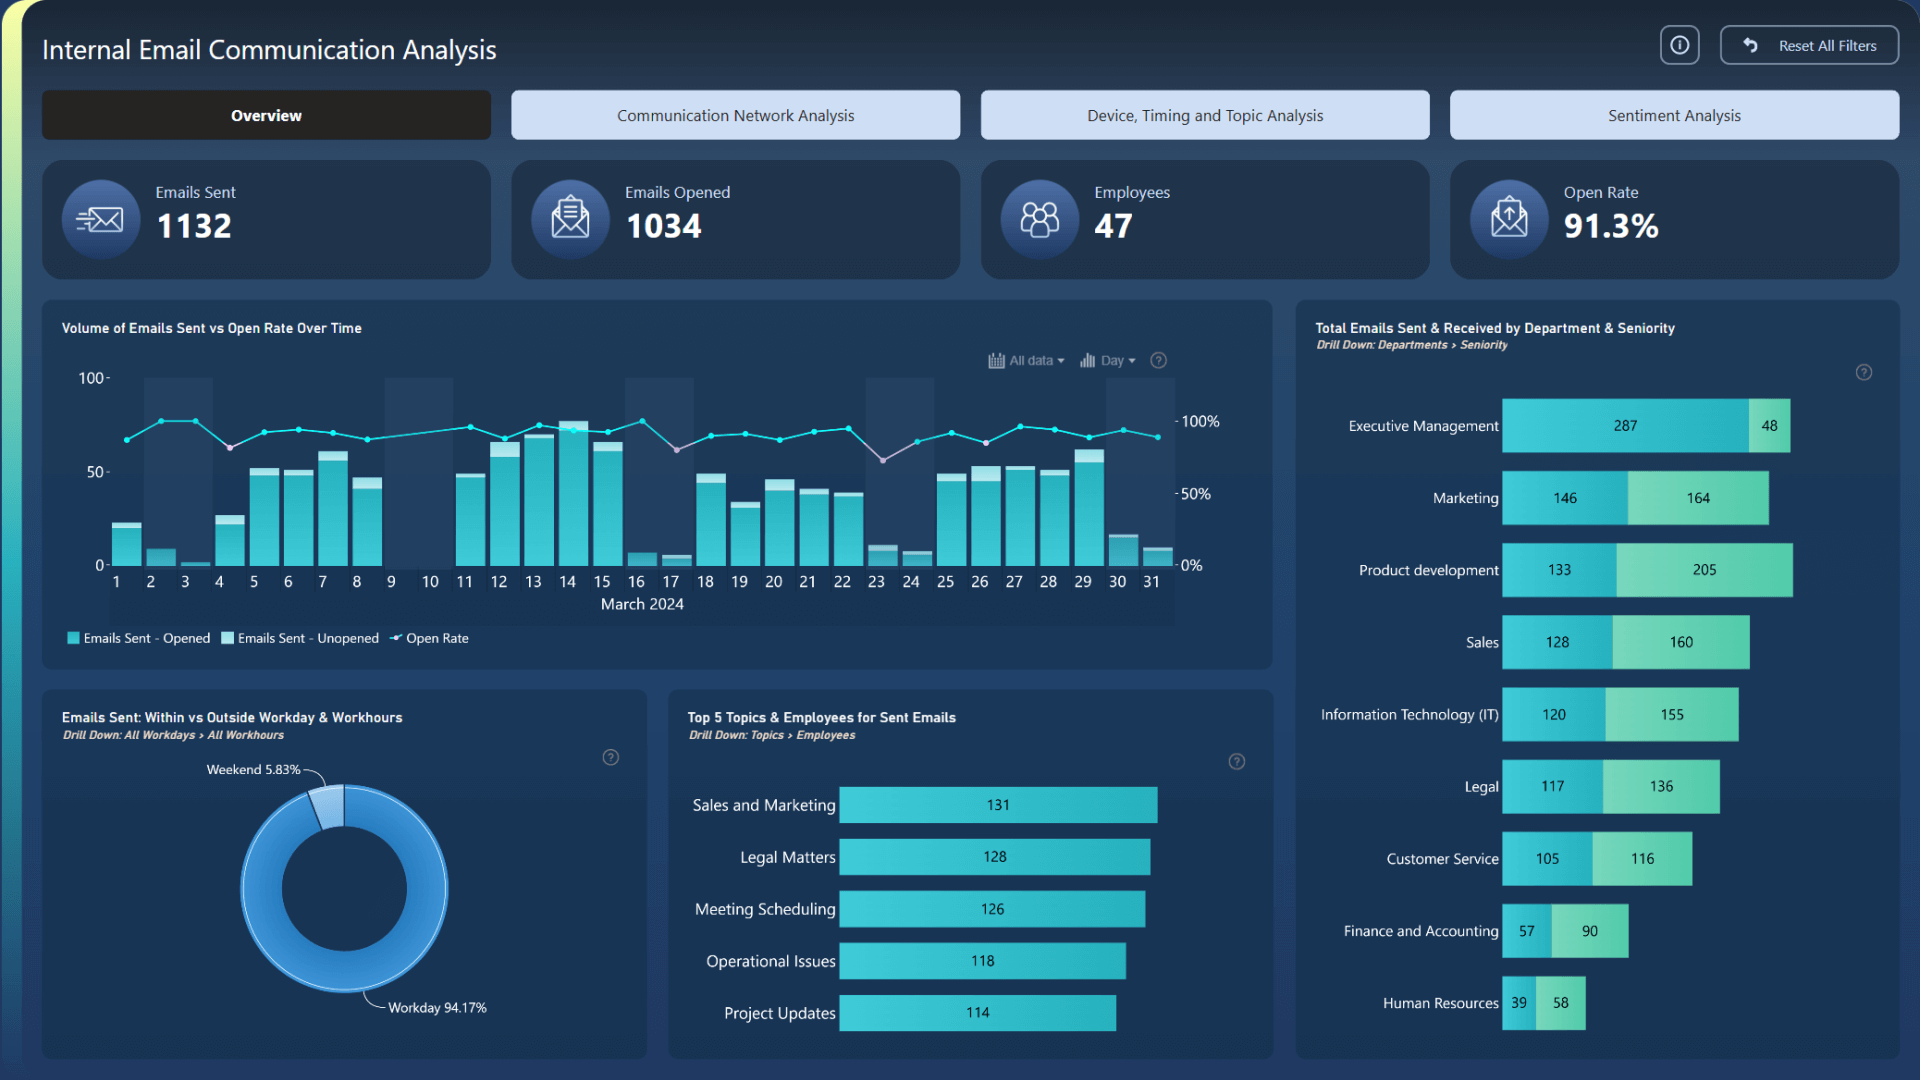
This Power BI email communication analysis report will help you uncover valuable insights about internal comms and keep your finger on the pulse of your company. Spot trends and patterns, reveal the most active communication networks and perform sentiment analysis – all within one report!

It is the winning entry for ZoomCharts Mini Challenge which was hosted as a part of the Onyx Data July 2024 Challenge.

Key Insights of This Report

This report visualizes a corporate email dataset and reveals various insights to analyze internal communications. The main metrics include:

  • Emails sent
  • Open rate
  • Time of sending / opening
  • Senders and recipients (name, department, seniority)
  • Email topics
  • Email sentiment (positive, neutral, negative)

The report is neatly structured into four pages, and the interactive visuals can be used to quickly and easily find answers to various questions, such as “what are the most active dates or times”, “what’s the sentiment of each department and how did it change over time”, “who sends the most emails during the weekends”, and many more.

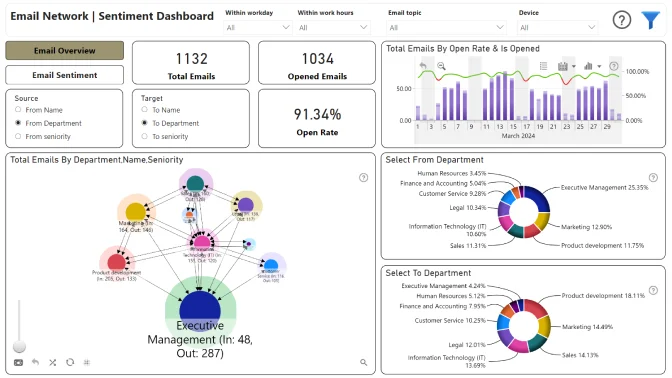
This data is visualized using interactive visuals, allowing users to drill down with just a click; and cross-chart filtering instantly shows relevant insights across the entire report page whenever the user selects data. Furthermore, the Graph PRO visual displays the entire communications network as an interactive graph, visualizing how employees or departments interact with each other.

The report is based on the challenge submission with minor design refinements by the ZoomCharts team. See the original submission here.

How To Use This Report Template

To interact with this Power BI email communication analysis report, simply click any active element directly on the chart.

Download the report file to see all the settings, formulas, and calculations. Try it out with your own data by making a few adjustments.

ZoomCharts visuals used

Drill Down Combo PRO Drill Down Combo PRO
Drill Down Graph PRO Drill Down Graph PRO
Drill Down Combo Bar PRO Drill Down Combo Bar PRO
Drill Down Timeline PRO Drill Down Timeline PRO
Drill Down Donut PRO Drill Down Donut PRO

Need help?

Send your question to ZoomCharts assistant, and we will respond to you as soon as possible.

Contact Us

Mobile view allows you to interact with the report. To Download the template please switch to desktop view.

Report Overhaul

ZoomCharts Academy

Learn ZoomCharts with experts and become certified!

Go to Academy!
Report Overhaul

Was this helpful? Thank you for your feedback!

Sorry about that.

How can we improve it?

Power BI Email Communication Analysis Report by Toyin Taiwo

Share

ZoomCharts

Welcome to ZoomCharts

You’re almost there! Create an account to keep your saved reports.

or
Sign up with Microsoft

Verify your email address

We have sent a code to your email address. Please input the code below.

Didn't receive code? Request again (after 30 seconds)

Already have an account? Log in

ZoomCharts

Log in to your ZoomCharts account

Log in with Microsoft
or
Forgot password?

Reset your password

We'll email you instructions on how to reset your password

Don't have an account? Sign up

Please add credits

You have 0 available downloads.
Get more credits or upgrade your plan to continue.

View pricing
logo
[email protected]
+44 204 577 3993
logo

Products

Drill Down Network PRO Drill Down Waterfall PRO Drill Down Graph PRO Drill Down Combo PRO Drill Down Combo Bar PRO Drill Down Donut PRO Drill Down Pie PRO Drill Down TimeSeries PRO Drill Down Timeline PRO Drill Down Map PRO Drill Down Scatter PRO All Visuals

Resources

Report Examples Webinars Blog ZoomCharts Academy Visuals Gallery Documentation Custom Visual Development Subscribe to News

Solutions

Custom Visual Development

Company

Pricing About Us Partners Leave feedback Join PowerGroup EU Funding

Help

ZoomCharts Assistance Contact Sales Contact Support FAQ

Drill Down Network PRO Drill Down Waterfall PRO Drill Down Graph PRO Drill Down Combo PRO Drill Down Combo Bar PRO Drill Down Donut PRO Drill Down Pie PRO Drill Down TimeSeries PRO Drill Down Timeline PRO Drill Down Map PRO Drill Down Scatter PRO All Visuals

Report Examples Webinars Blog ZoomCharts Academy Visuals Gallery Documentation Custom Visual Development Subscribe to News

Custom Visual Development

Pricing About Us Partners Leave feedback Join PowerGroup EU Funding

ZoomCharts Assistance Contact Sales Contact Support FAQ
+44 204 577 3993
[email protected]

Ready to get in touch?

Contact our experts with any question about Power BI and ZoomCharts for Free!

Contact us

© 2025, Data Visualization Software Lab

U.S. Patents No. 11,645,343; 11,921,804; 12,346,389

Cookies
Privacy Policy
Global
Legal
Patent
warning

Error message

success

Success info: Done!

ZoomCharts AI Assistant

We noticed you're using an old OS version.

For the best experience, we recommend upgrading to ensure that all website features display correctly.

Cookie settings

We use necessary cookies for site functionality, as well as statistic, marketing, and preference cookies to enhance your experience. For more information and to manage your preferences, please visit our Cookie policy