1685
Power BI Banking Dashboard Example
Power BI Banking Dashboard Example
More Report pages
Report Author: Daniel Nte
1685
Share template with others
Summary
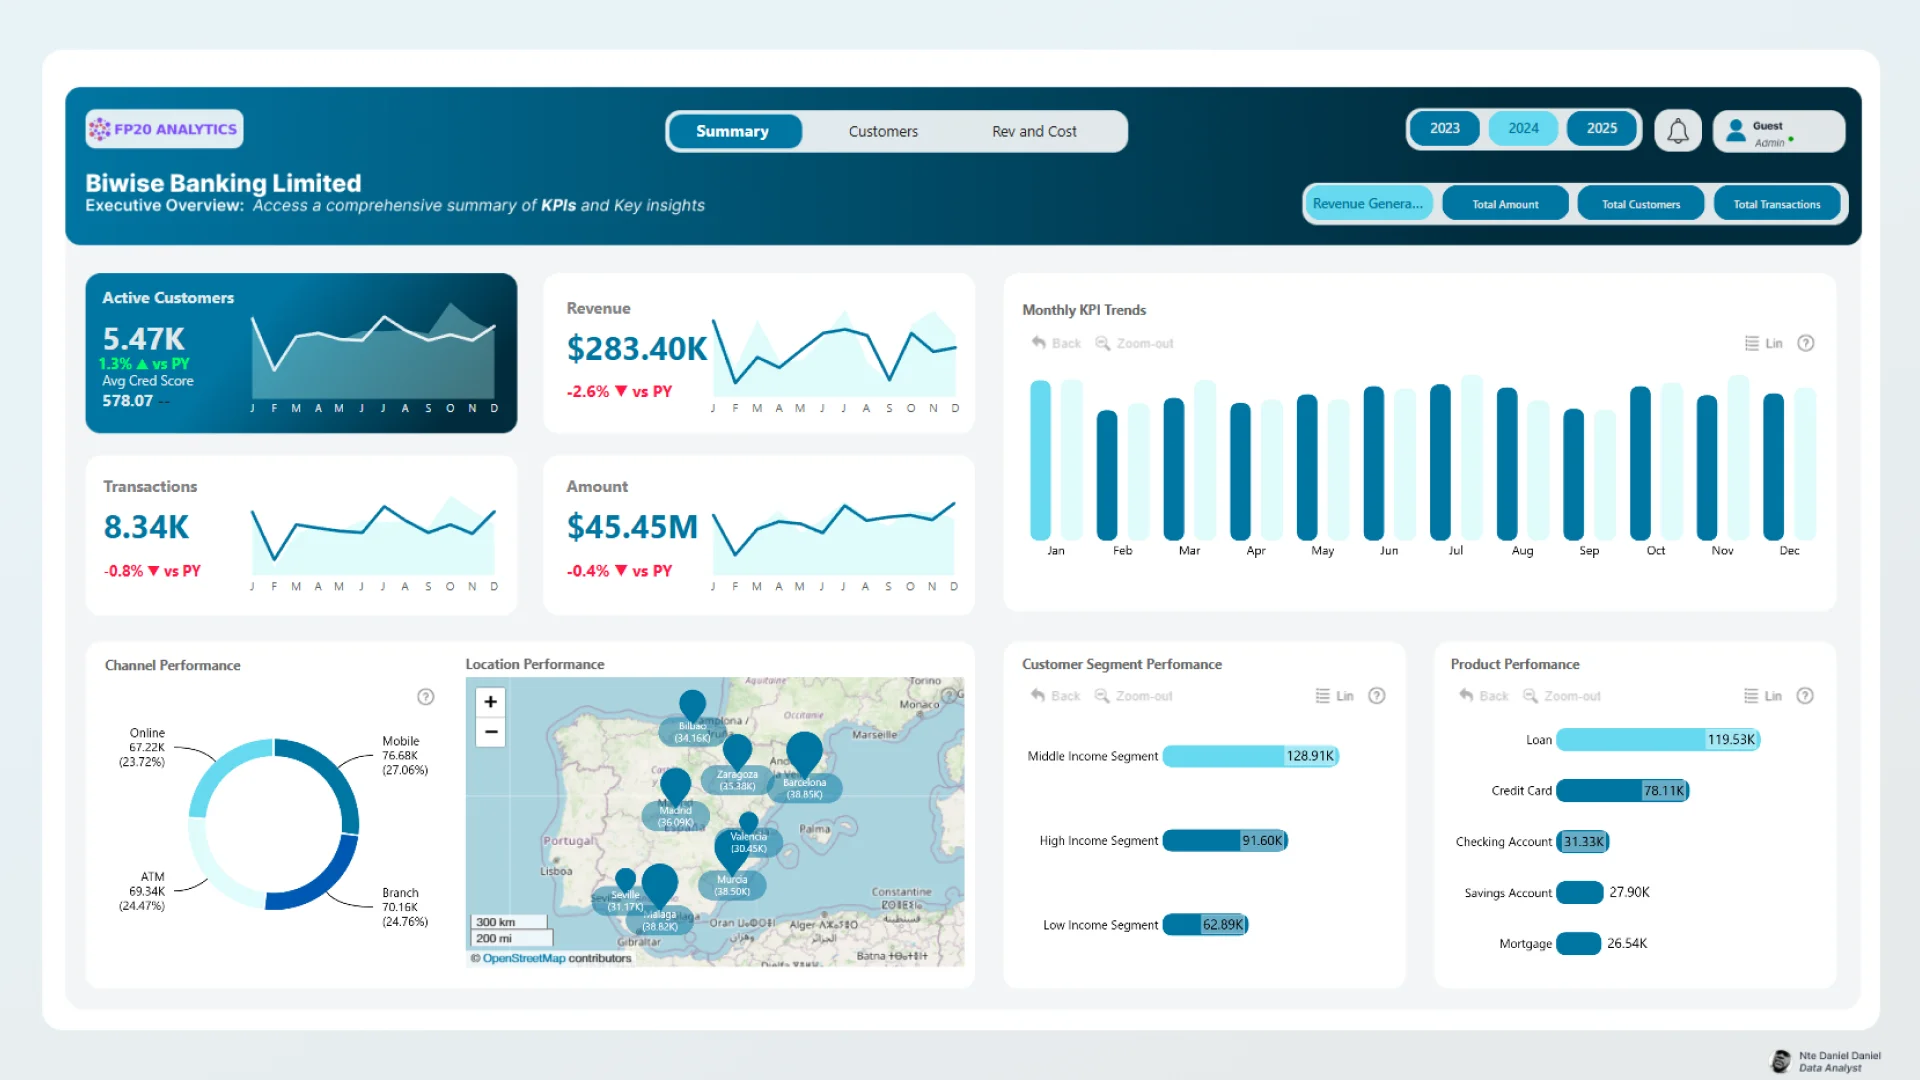
This Power BI banking dashboard template was submitted for the FP20 Analytics ZoomCharts Challenge, June 2025, using the Banking Customers & Transactions dataset.
It is a strong example of using Power BI for banking analytics, giving users a clear view of customer activity, transaction volume, revenue, costs, product performance, and customer segment behavior in one interactive report.
Key Insights of Power BI Banking Dashboard Template
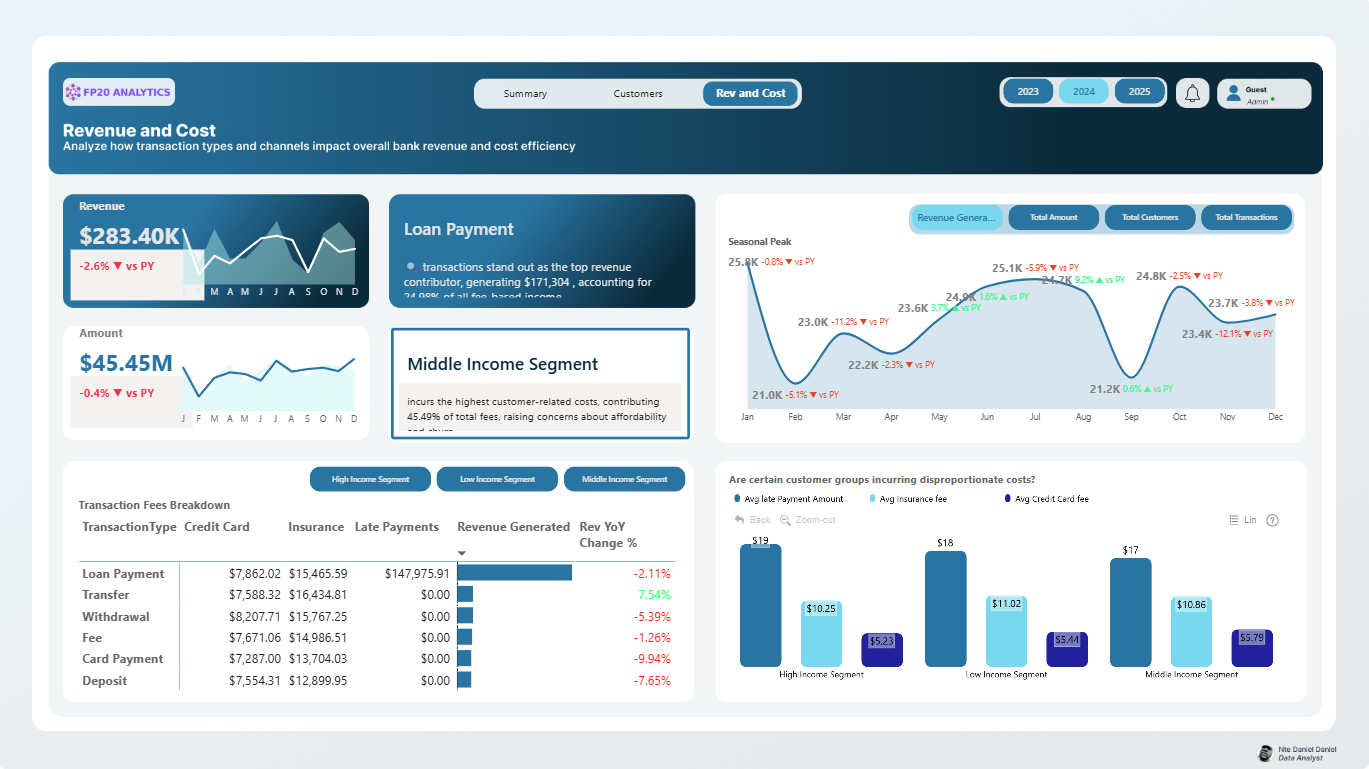
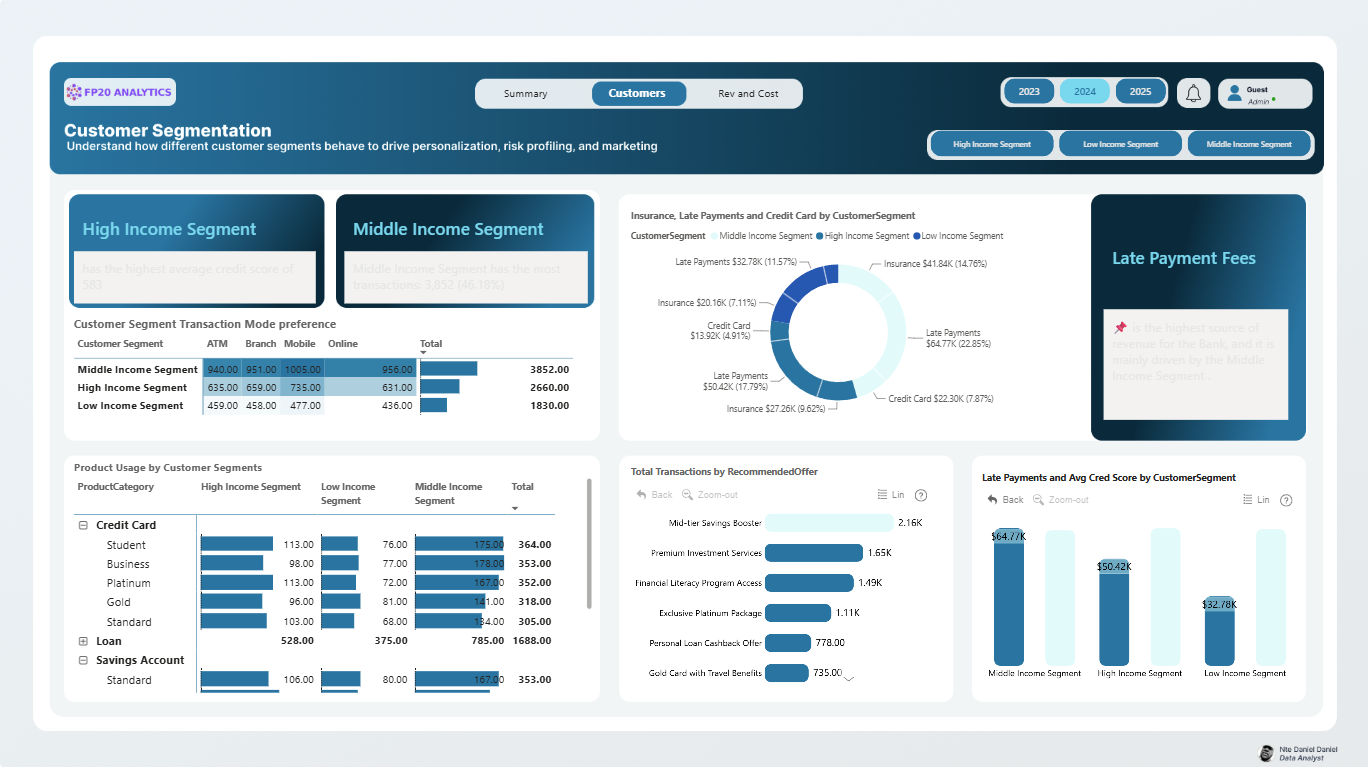
The report is structured across three main pages: Summary, Customers, and Revenue and Cost. The initial view provides an executive overview, while the additional pages allow users to explore customer segmentation and financial performance in more detail. Some of the main insights include:
- Banking performance overview: active customers, total revenue, transaction count, total amount, and average credit score
- Customer activity: transaction trends, customer segment performance, and channel usage across mobile, branch, ATM, and online banking
- Product performance: revenue and usage patterns across loans, credit cards, checking accounts, savings accounts, and mortgages
- Revenue and cost analysis: transaction fees, insurance fees, late payment fees, revenue generated, and year-over-year revenue change
- Customer segmentation: high, middle, and low income segment behavior, product preferences, recommended offers, and late payment patterns
- Geographic insights: location-based banking performance displayed through an interactive map view
With a clean executive layout and interactive ZoomCharts visuals, this Power BI banking dashboard makes it easier to compare financial KPIs, identify customer behavior patterns, and analyze performance across products, channels, locations, and income segments.
This report was created by Daniel Nte and includes ZoomCharts Drill Down PRO visuals for Power BI, including Combo, Combo Bar, Map, and Donut visuals.
How to Use This Power BI Banking Dashboard Template
To interact with this Power BI banking dashboard, click on any active chart element to filter the report and explore the data from different angles. Users can analyze banking performance by year, revenue metric, customer segment, product category, transaction type, channel, and location.
Download the .pbix file to review the dashboard structure, visual settings, formulas, and calculations. You can also adapt the template with your own banking or financial services data to monitor customer performance, transaction behavior, revenue trends, product usage, and operational efficiency.
ZoomCharts visuals used




4U Report Challenges
Participate in data challenges, build and submit reports to get free template downloads.
Join CommunityMobile view allows you to interact with the report. To Download the template please switch to desktop view.
How to use a PBIX template
Preview the interactive report, download the PBIX file, open it in Power BI Desktop, and replace the same data connection with your own dataset.
Preview and download
Explore the report online and download the PBIX template file.
Open in Power BI Desktop
Open the downloaded PBIX file in Power BI Desktop.
Connect your data
Replace the sample data source with your own dataset.
Refresh and adjust
Refresh the model and update fields or visual were needed.
Save and share
Save your report and publish it for your audience.


