323
Power BI B2B Profitability Dashboard
Power BI B2B Profitability Dashboard
More Report pages
Report Author: Oluwadamilare Shittu
323
Share template with others
This Power BI B2B Profitability Dashboard provides a detailed view of customer, product, sales, and profit performance across a global B2B business.
The report helps users analyze sales trends, customer performance, product profitability, order behavior, returns, industries, channels, promotions, and payment methods across multiple years.
Dashboard Overview
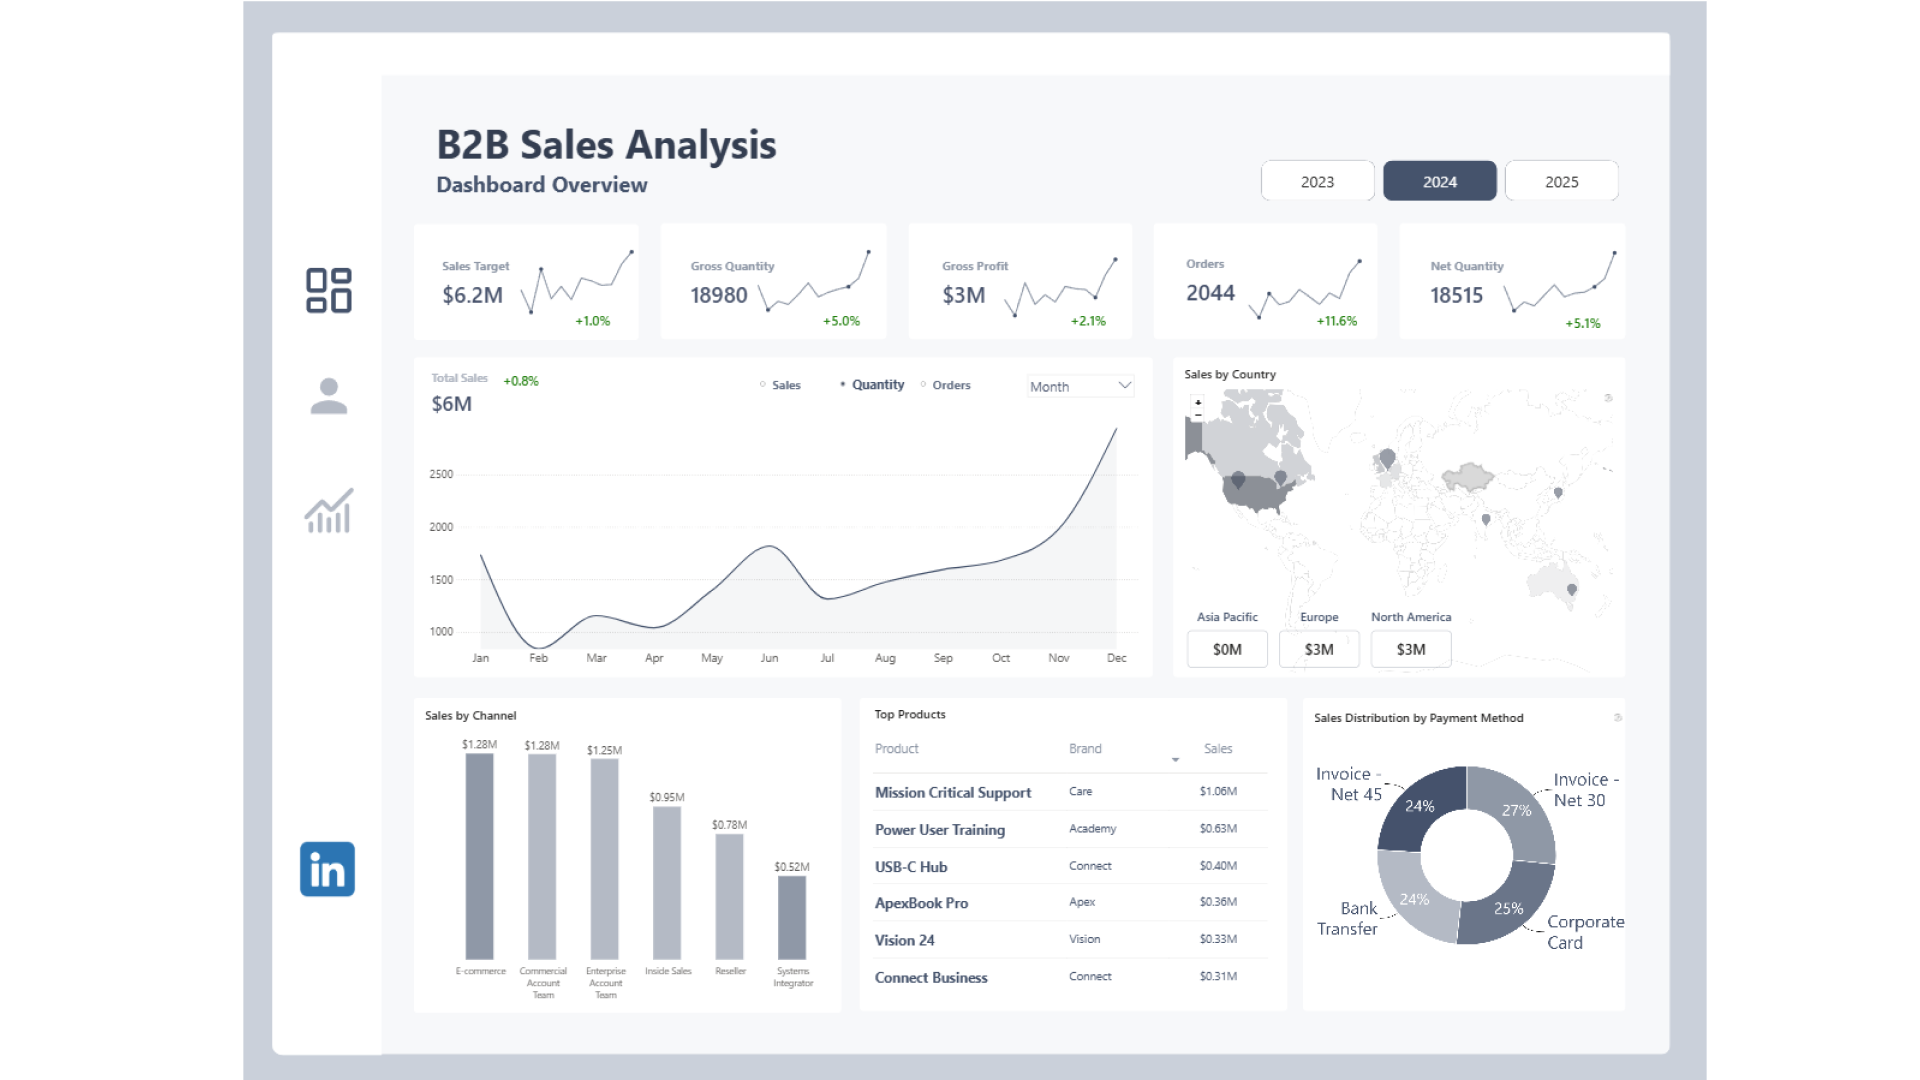
The Dashboard Overview page gives a high-level view of overall B2B sales performance and makes it easy to track the most important commercial KPIs over time.
- Track Sales Target, Gross Quantity, Gross Profit, Orders, and Net Quantity.
- Follow Total Sales across months and compare sales, quantity, and order trends.
- Explore geographic sales performance using the Sales by Country map.
- Compare sales across different sales channels and account teams.
- Identify the top-performing products and brands based on sales.
- Analyze the distribution of sales across different payment methods.
Customer & Product Analysis
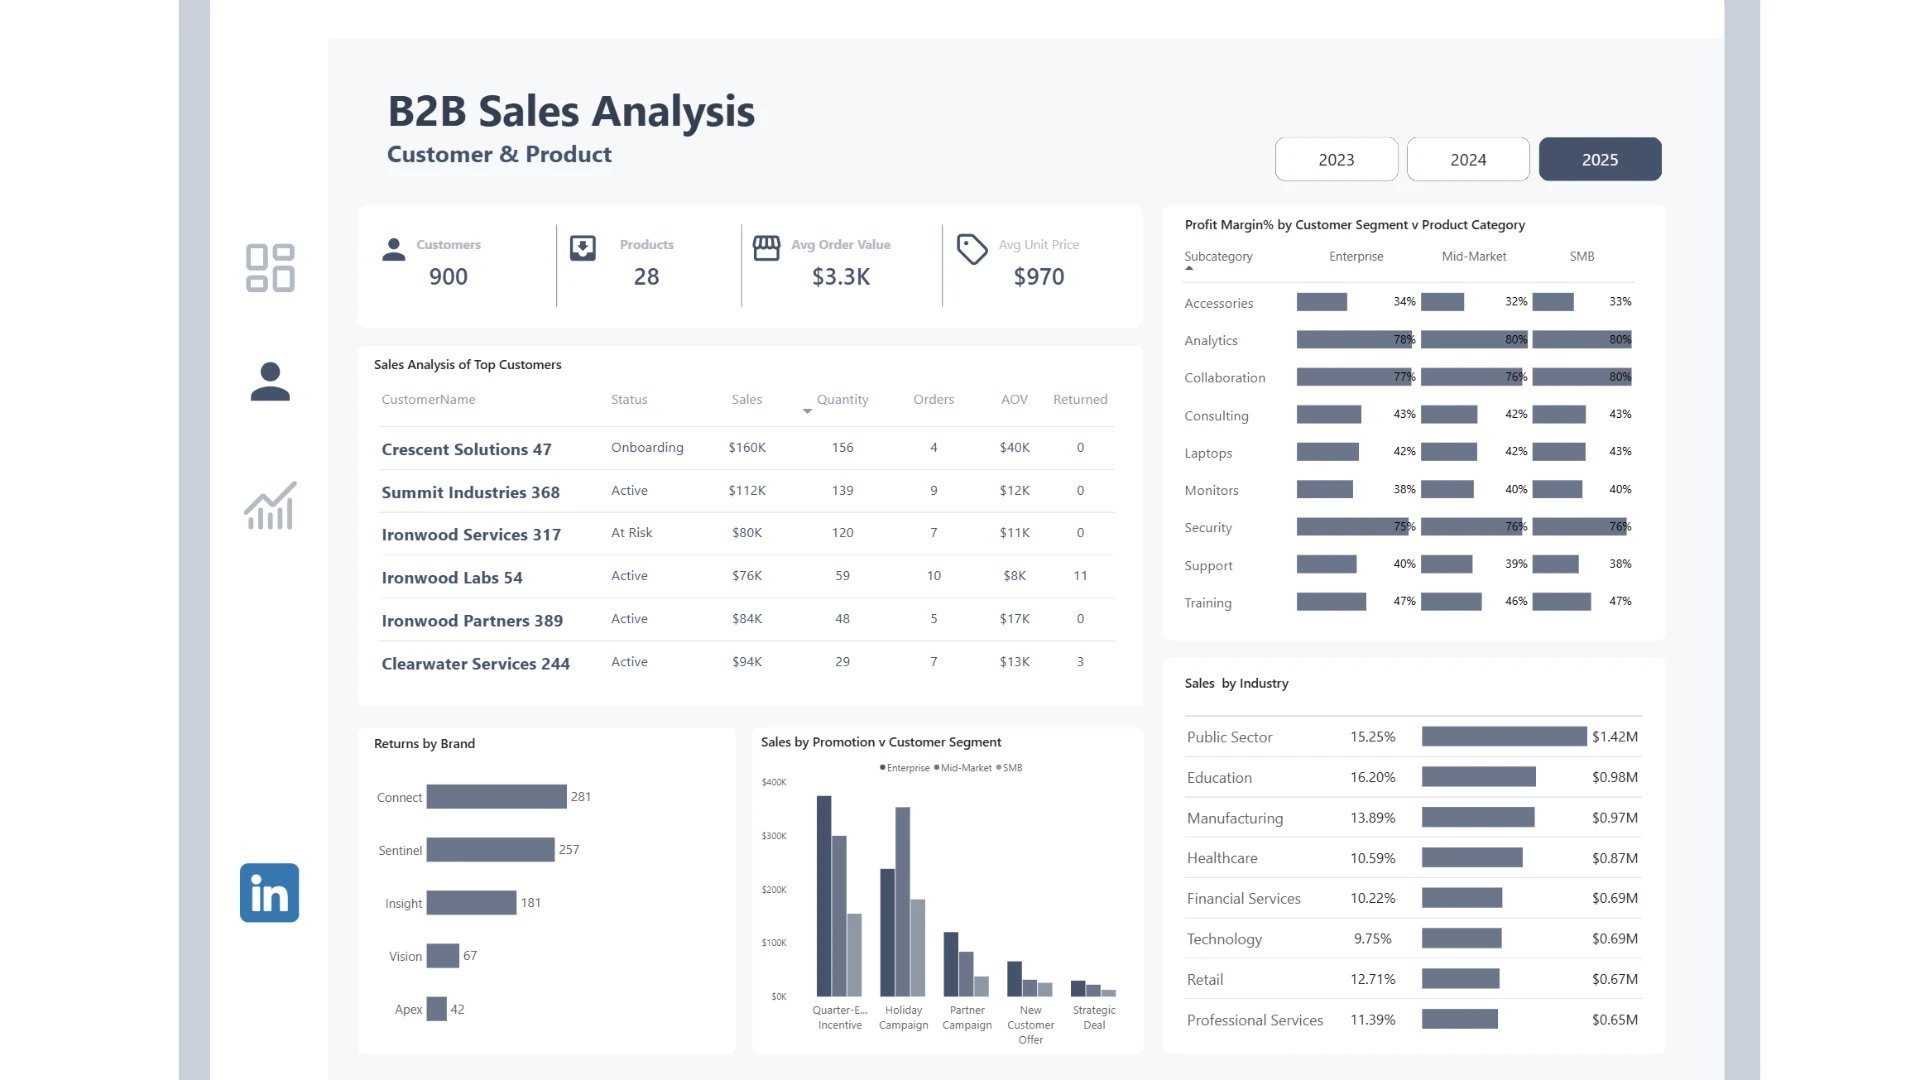
The Customer & Product page focuses on understanding customer value, product profitability, returns, promotions, and industry performance.
- Track the number of Customers, Products, Average Order Value, and Average Unit Price.
- Compare top customers by Sales, Quantity, Orders, AOV, Status, and Returned Orders.
- Analyze Profit Margin % by customer segment and product subcategory.
- Identify brands with the highest number of product returns.
- Compare sales generated by different promotions across Enterprise, Mid-Market, and SMB customers.
- Evaluate sales performance across industries such as Public Sector, Education, Manufacturing, Healthcare, Financial Services, Technology, Retail, and Professional Services.
Profitability Analysis
The report connects customer and product performance with profitability metrics, making it easier to understand what is driving both revenue and margin.
- Compare Gross Profit across products, customers, industries, and segments.
- Analyze Profit Margin % across different product subcategories.
- Identify categories with strong sales but comparatively weaker margins.
- Compare high-value customers using Sales, AOV, order quantity, and return behavior.
- Investigate whether promotion-driven sales are generating profitable growth across different customer segments.
Customer Performance
Customer-level analysis provides a detailed view of account performance and makes it possible to identify valuable customers as well as accounts that may require attention.
- Rank customers by total sales and order activity.
- Compare Average Order Value across key accounts.
- Monitor customer status such as Active, Onboarding, and At Risk.
- Identify customers with unusually high returned order volumes.
- Compare customer value across different market segments.
Interactive Exploration
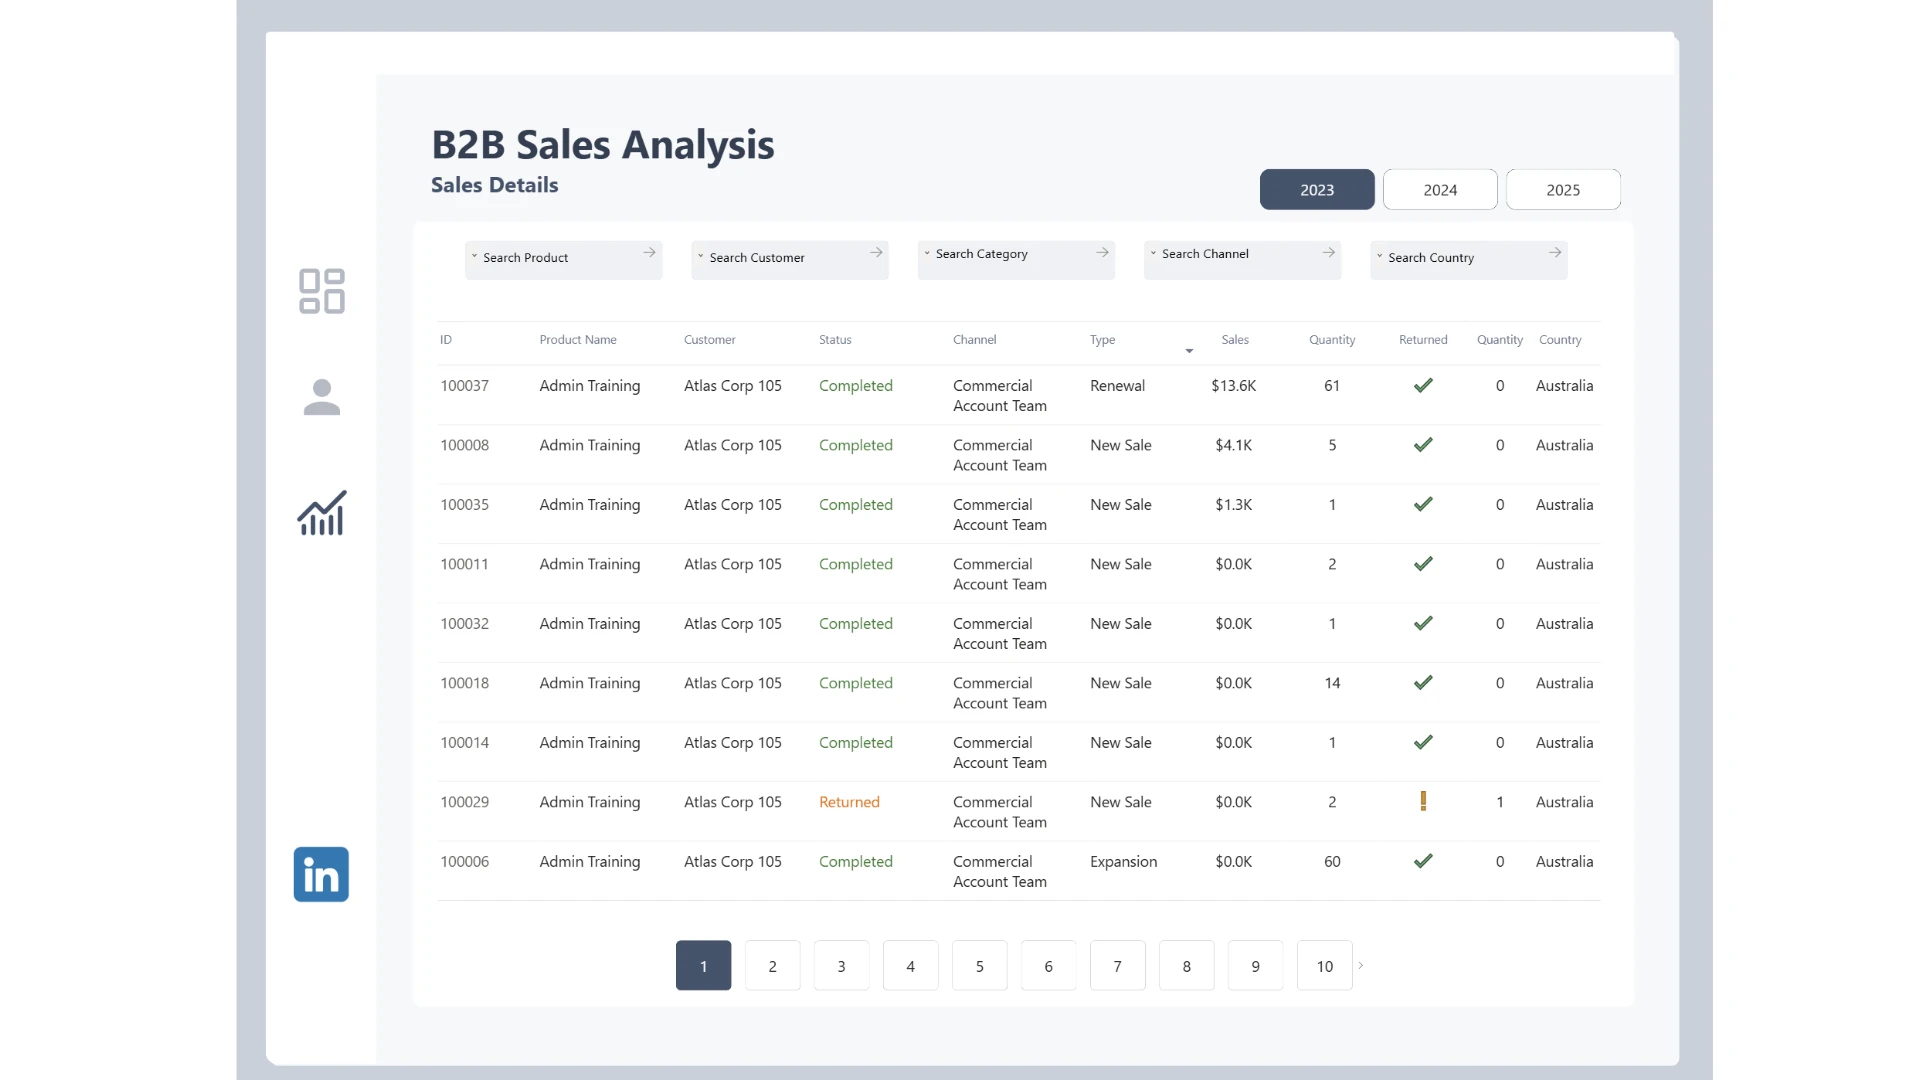
The report is designed for interactive exploration, allowing users to compare performance across years and move between summary-level KPIs and detailed customer or product analysis.
- Switch between 2023, 2024, and 2025 to compare performance over time.
- Explore sales by country, channel, product, brand, industry, and customer segment.
- Compare customer and product performance using multiple KPIs in the same report.
- Use visual comparisons to quickly identify high-performing and underperforming areas.


4U Report Challenges
Participate in data challenges, build and submit reports to get free template downloads.
Join CommunityMobile view allows you to interact with the report. To Download the template please switch to desktop view.
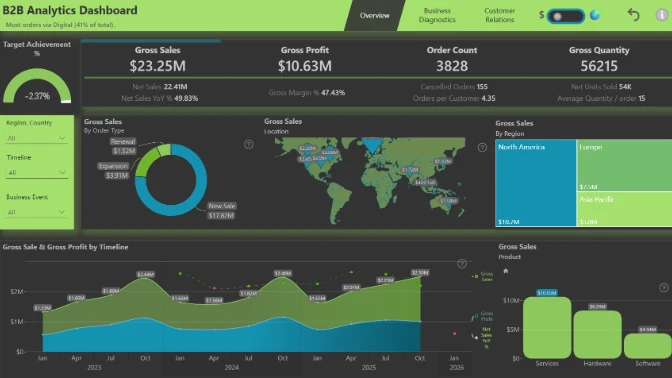
How to use a PBIX template
Preview the interactive report, download the PBIX file, open it in Power BI Desktop, and replace the same data connection with your own dataset.
Preview and download
Explore the report online and download the PBIX template file.
Open in Power BI Desktop
Open the downloaded PBIX file in Power BI Desktop.
Connect your data
Replace the sample data source with your own dataset.
Refresh and adjust
Refresh the model and update fields or visual were needed.
Save and share
Save your report and publish it for your audience.


