664
Pharmacy Sales Power BI Report 7
Pharmacy Sales Power BI Report 7
Report Author: Ishita Chowdhury
664
Share template with others
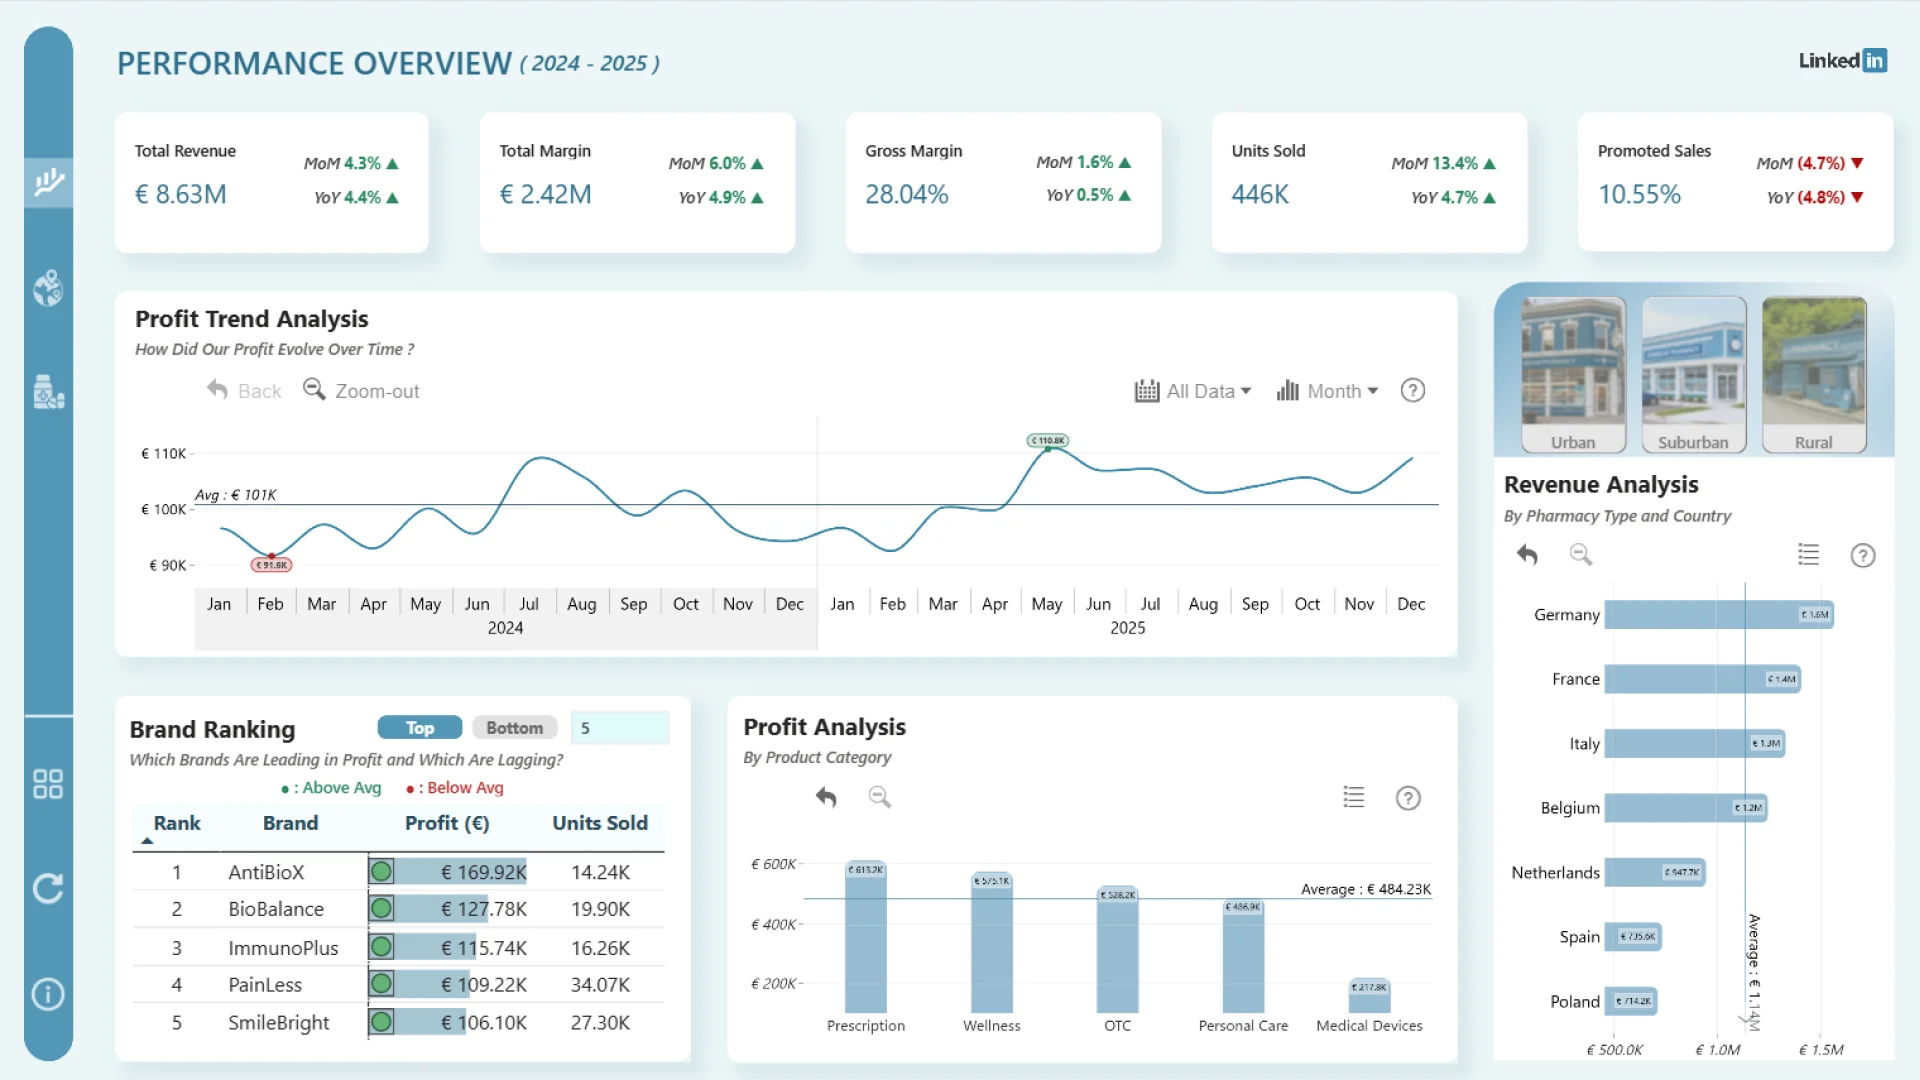
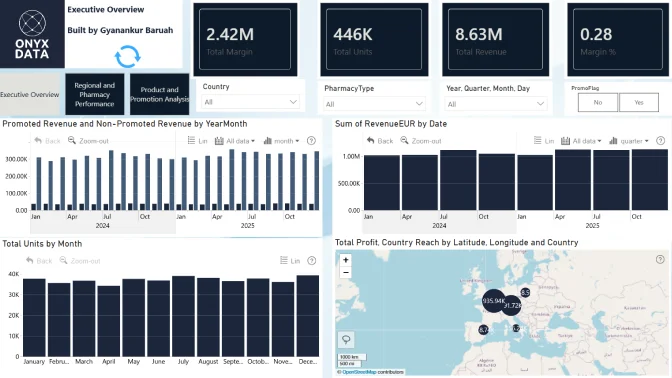
This Power BI report uses the Pharmacy Sales and Profitability dataset. The report features ZoomCharts Drill Down PRO custom visuals for Power BI. It was submitted to the Onyx Data DataDNA ZoomCharts Mini Challenge in January - February 2026.
Author’s Description:
This dashboard reviews the sales performance of pharmacy networks across Europe using 2024-2025 data. It highlights profitability trends, regional benchmarks, and operational efficiency across different markets. Stakeholders can track high-volume products and compare pharmacy-level results against European averages. Overall, it serves as a practical tool to improve supply chain decisions and support business growth.
ZoomCharts visuals used
4U Report Challenges
Participate in data challenges, build and submit reports to get free template downloads.
Join CommunityMobile view allows you to interact with the report. To Download the template please switch to desktop view.
Was this helpful? Thank you for your feedback!
Sorry about that.
How can we improve it?