915
Pharmacy Sales Power BI Report 11
Pharmacy Sales Power BI Report 11
Report Author: Mercy Chukwu
915
Share template with others
This Power BI report uses the Pharmacy Sales and Profitability dataset. The report features ZoomCharts Drill Down PRO custom visuals for Power BI. It was submitted to the Onyx Data DataDNA ZoomCharts Mini Challenge in January - February 2026.
Author’s Description:
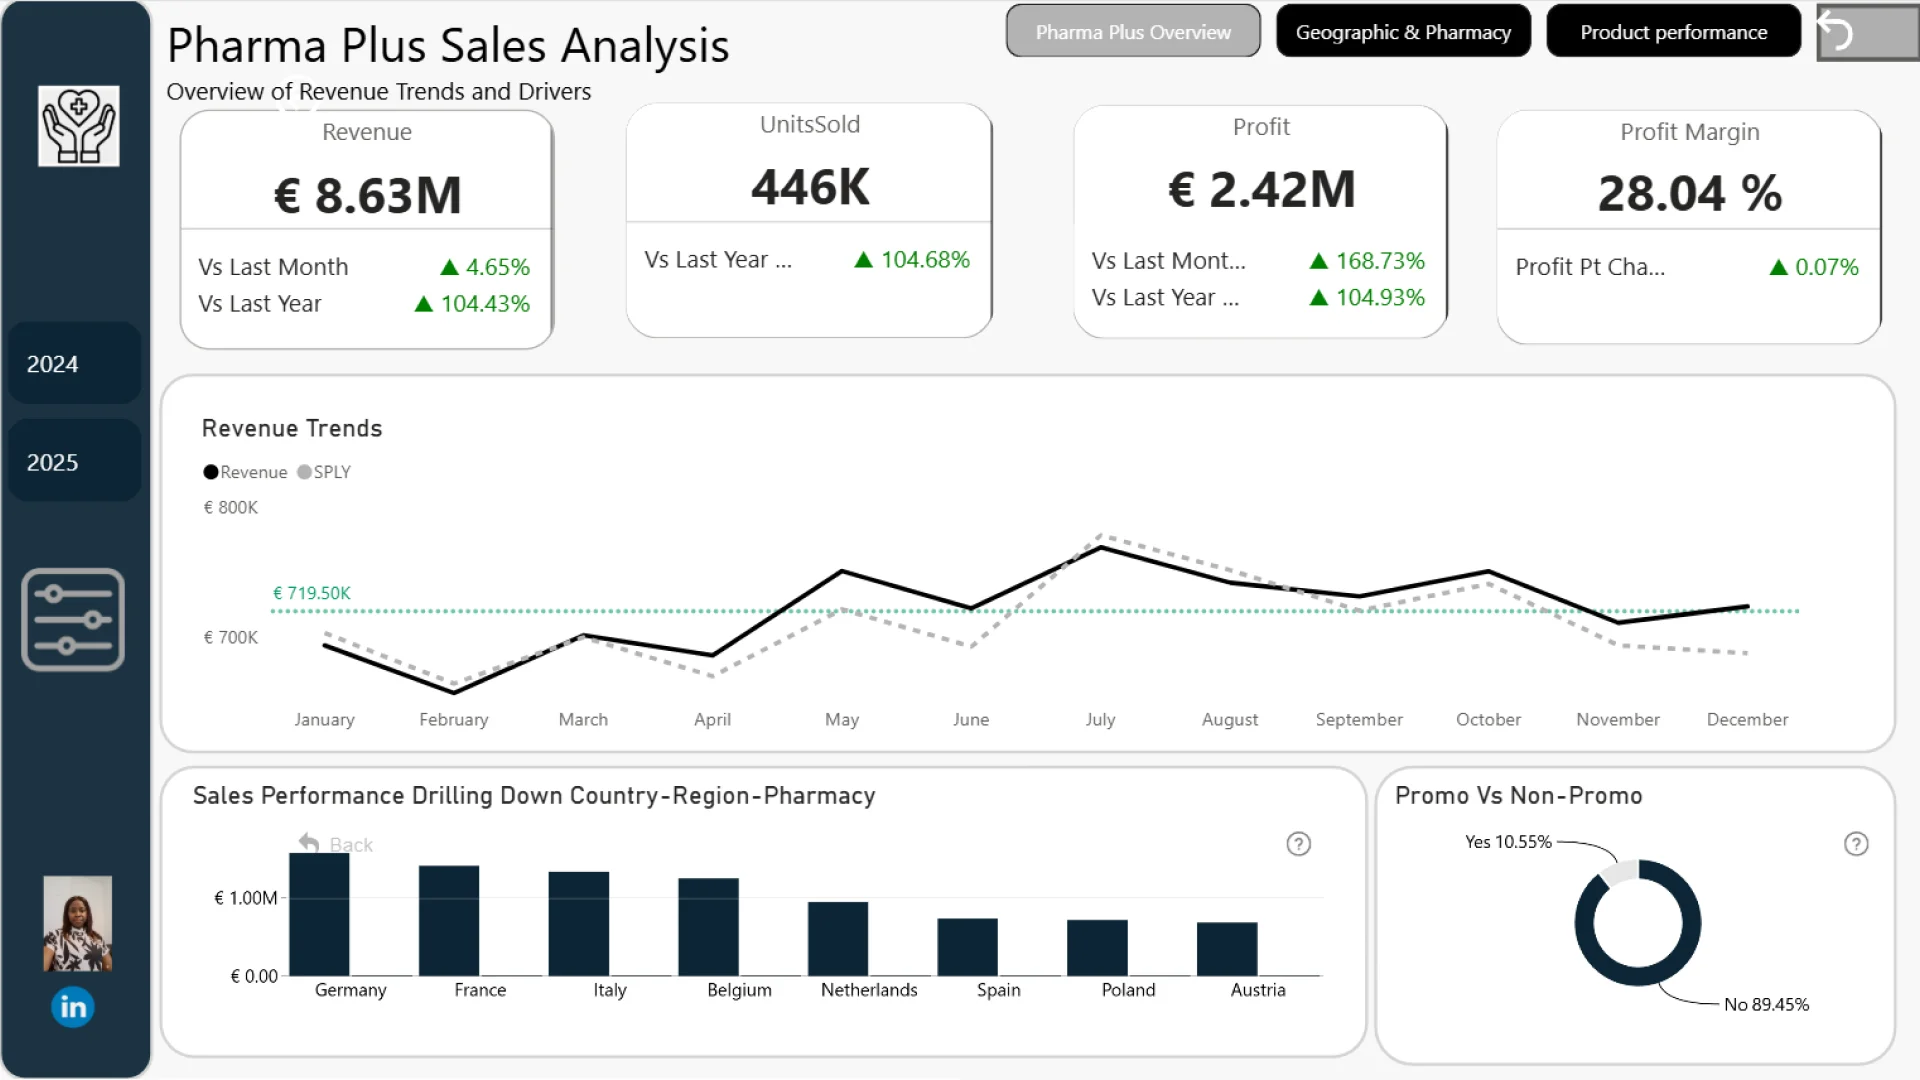
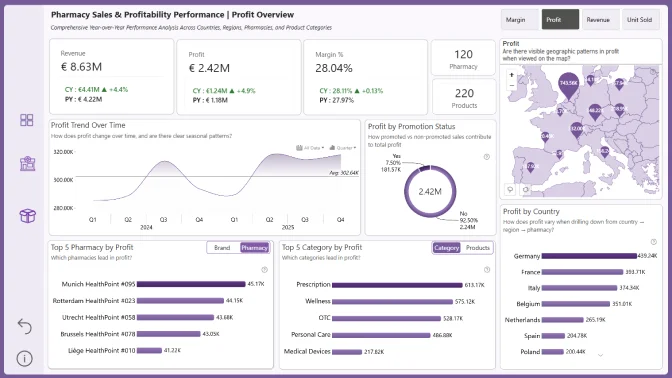
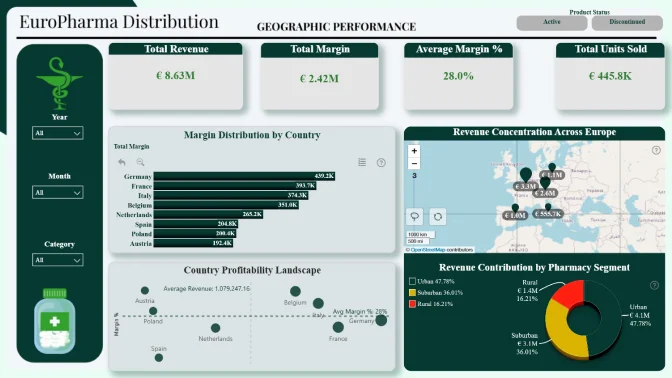
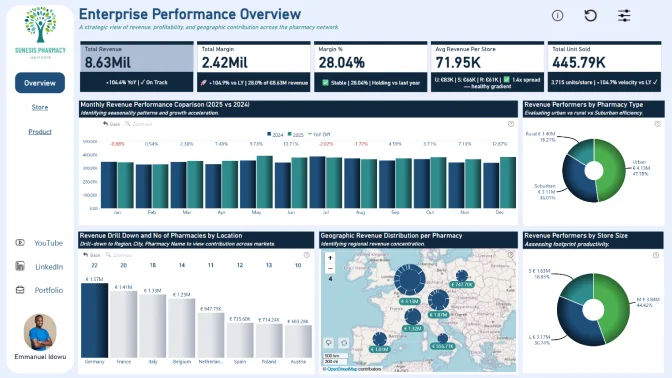
This report presents a comprehensive analysis of the Pharma Plus dataset to help stakeholders understand sales, profitability, product performance, and pharmacy dynamics across countries and regions from 2024 to 2025. The dataset includes daily transaction-level records by product and pharmacy, supported by time, geographic, and pharmacy hierarchy dimensions, and focuses on four core metrics: sales revenue, units sold, profit, and profit margin. Year-over-year comparison shows a 0.07 percentage point improvement in profit margin in 2025, with average monthly revenue reaching €719.18K and stronger sales momentum in the second half of the year. Geographic analysis highlights performance disparities, with Munich HealthPoint #097 in Bavaria contributing 1.88% of global revenue at a 27.83% margin, while Vienna HealthPoint #115 underperformed significantly. Product analysis also identified several inactive items in 2025, although around 70% of active products maintained healthy profit margins, indicating a resilient overall product mix.



4U Report Challenges
Participate in data challenges, build and submit reports to get free template downloads.
Join CommunityMobile view allows you to interact with the report. To Download the template please switch to desktop view.
How to use a PBIX template
Preview the interactive report, download the PBIX file, open it in Power BI Desktop, and replace the same data connection with your own dataset.
Preview and download
Explore the report online and download the PBIX template file.
Open in Power BI Desktop
Open the downloaded PBIX file in Power BI Desktop.
Connect your data
Replace the sample data source with your own dataset.
Refresh and adjust
Refresh the model and update fields or visual were needed.
Save and share
Save your report and publish it for your audience.


