796
Pharmacy Sales Power BI Dashboard 7
Pharmacy Sales Power BI Dashboard 7
More Report pages
Report Author: Nina Ikpe
796
Share template with others
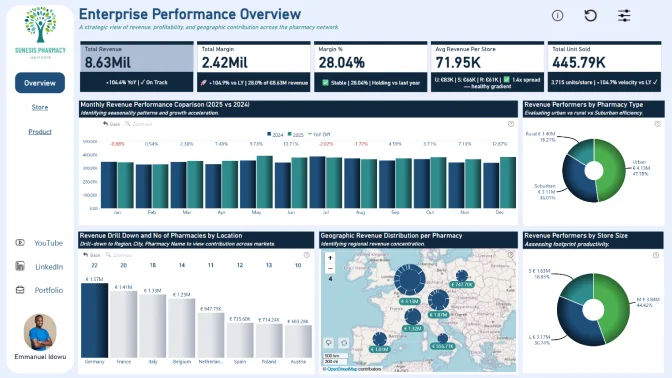
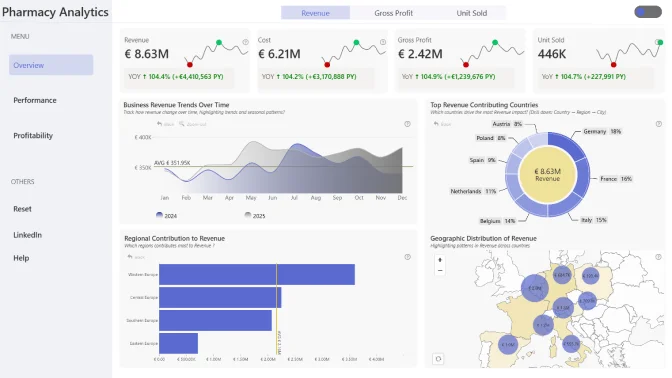
This Power BI report uses the Pharmacy Sales and Profitability dataset. The report features ZoomCharts Drill Down PRO custom visuals for Power BI. It was submitted to the Onyx Data DataDNA ZoomCharts Mini Challenge in January - February 2026.
Author’s Description:
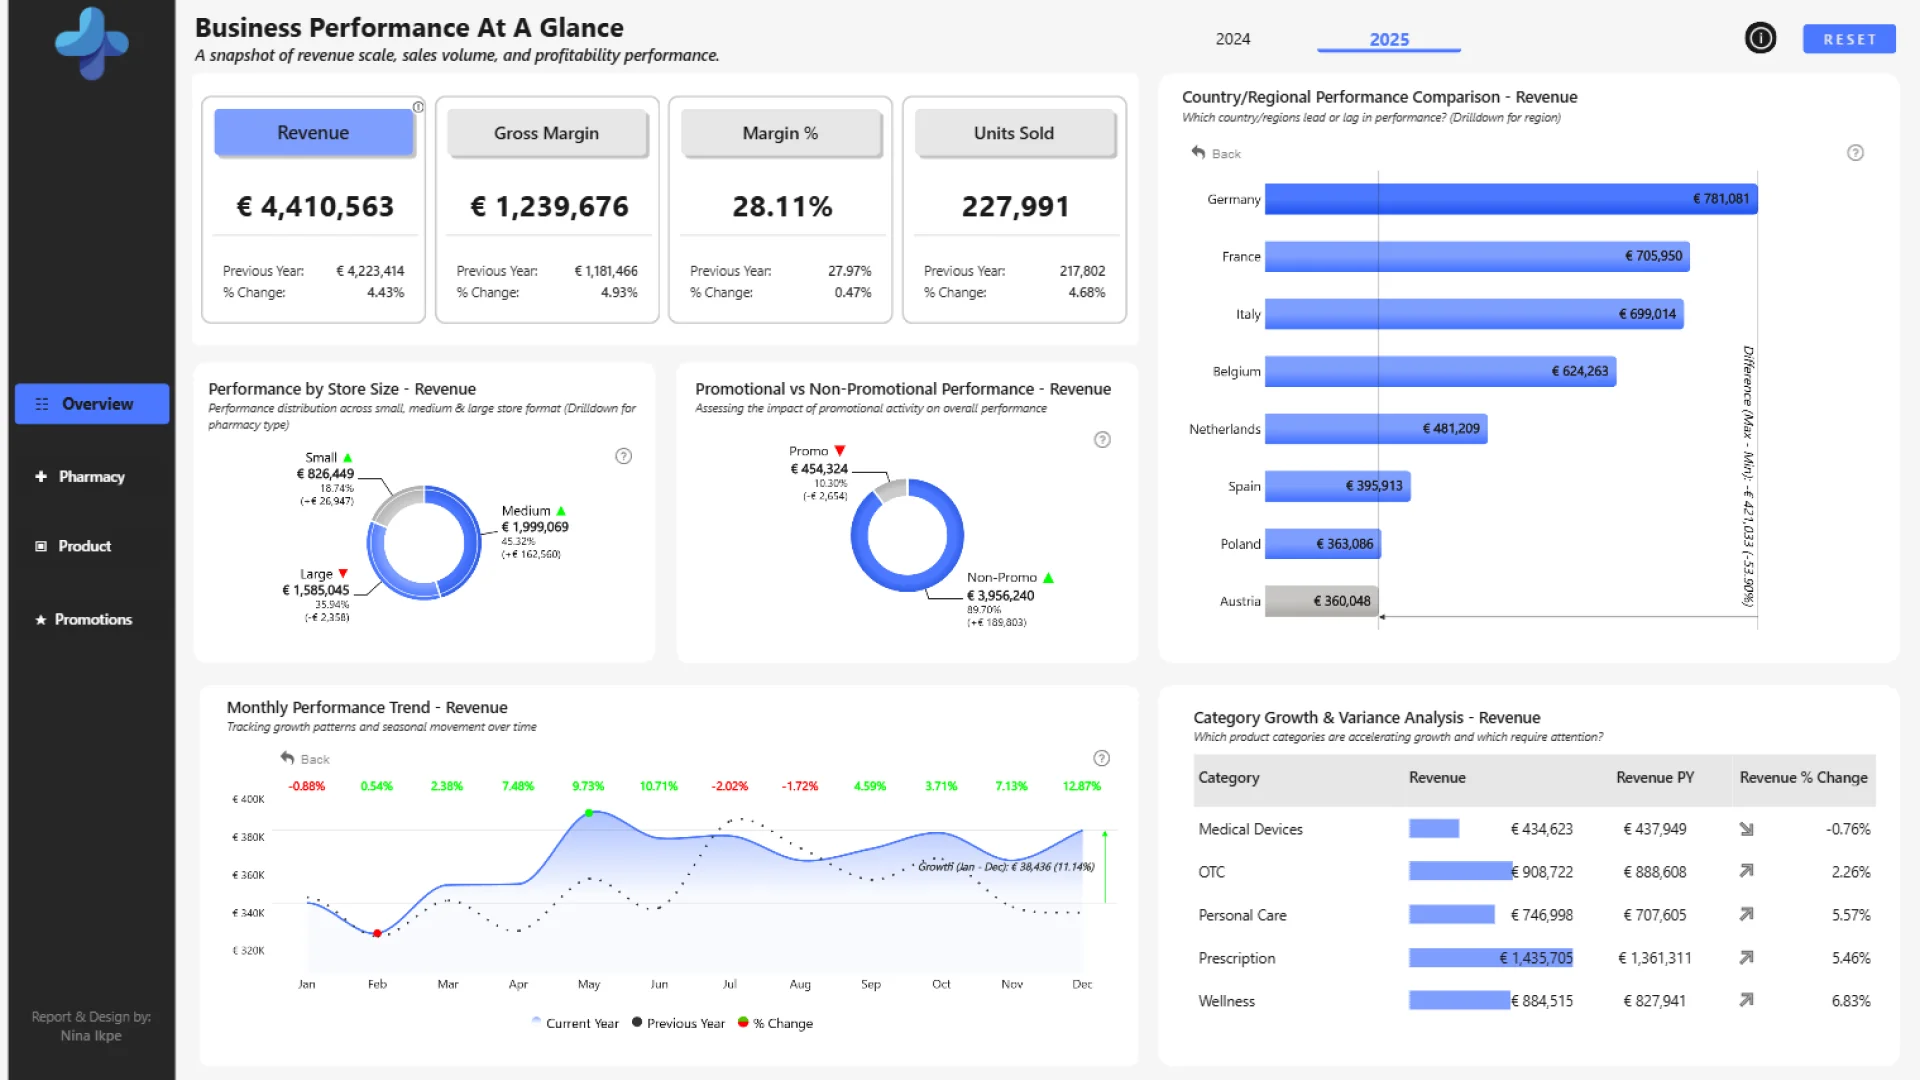
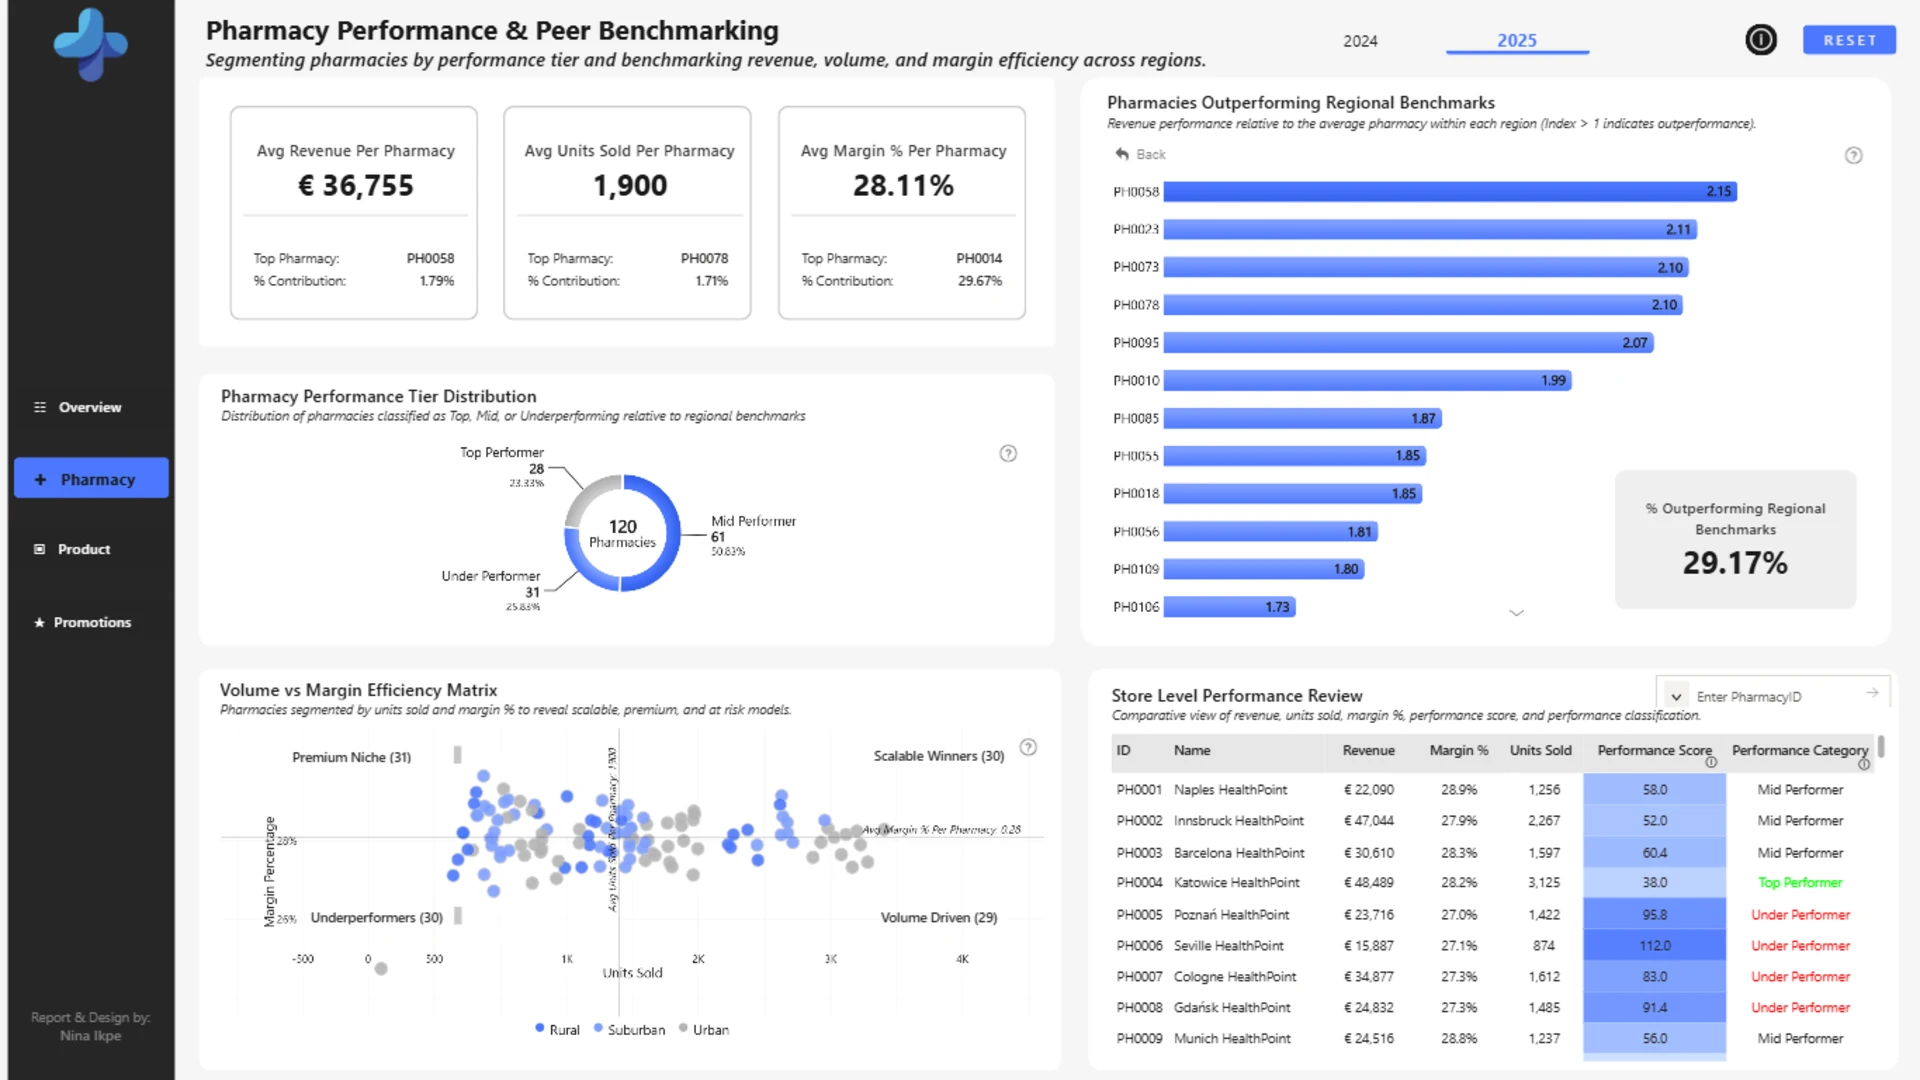
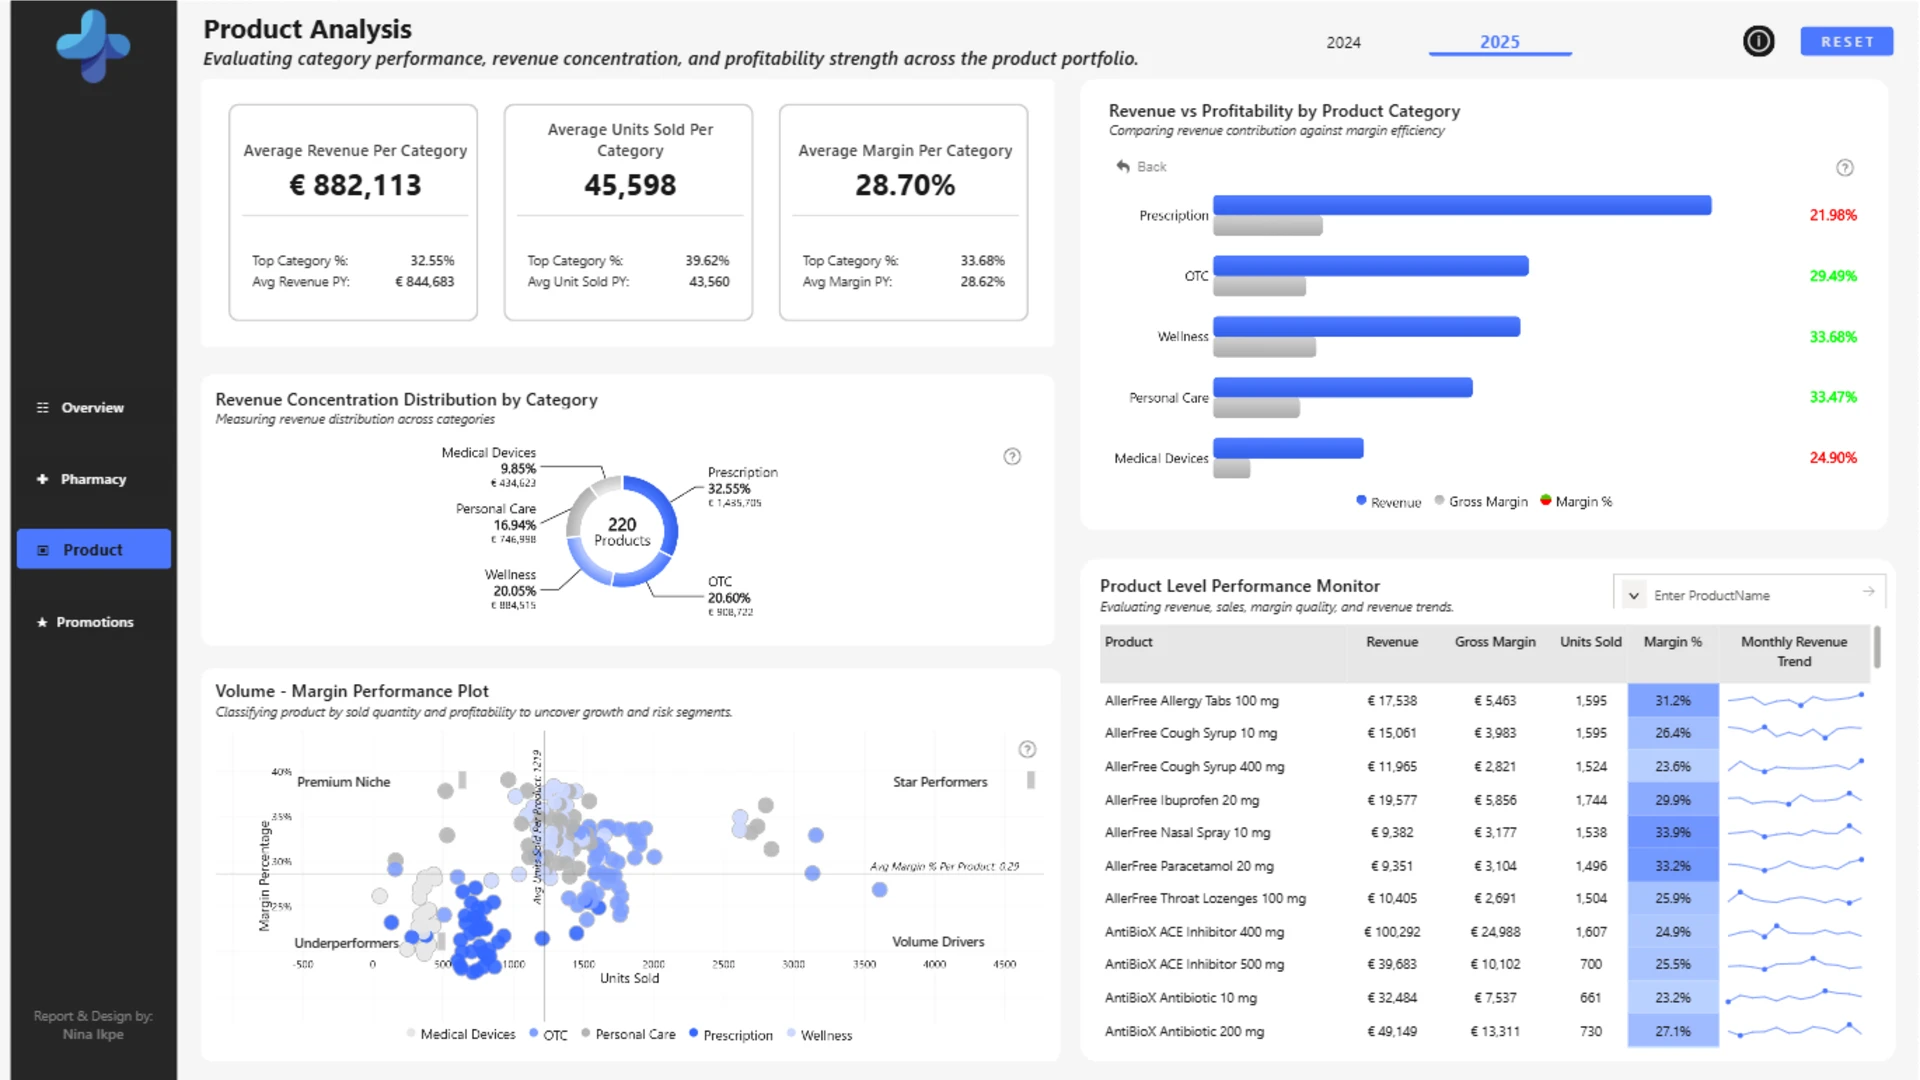
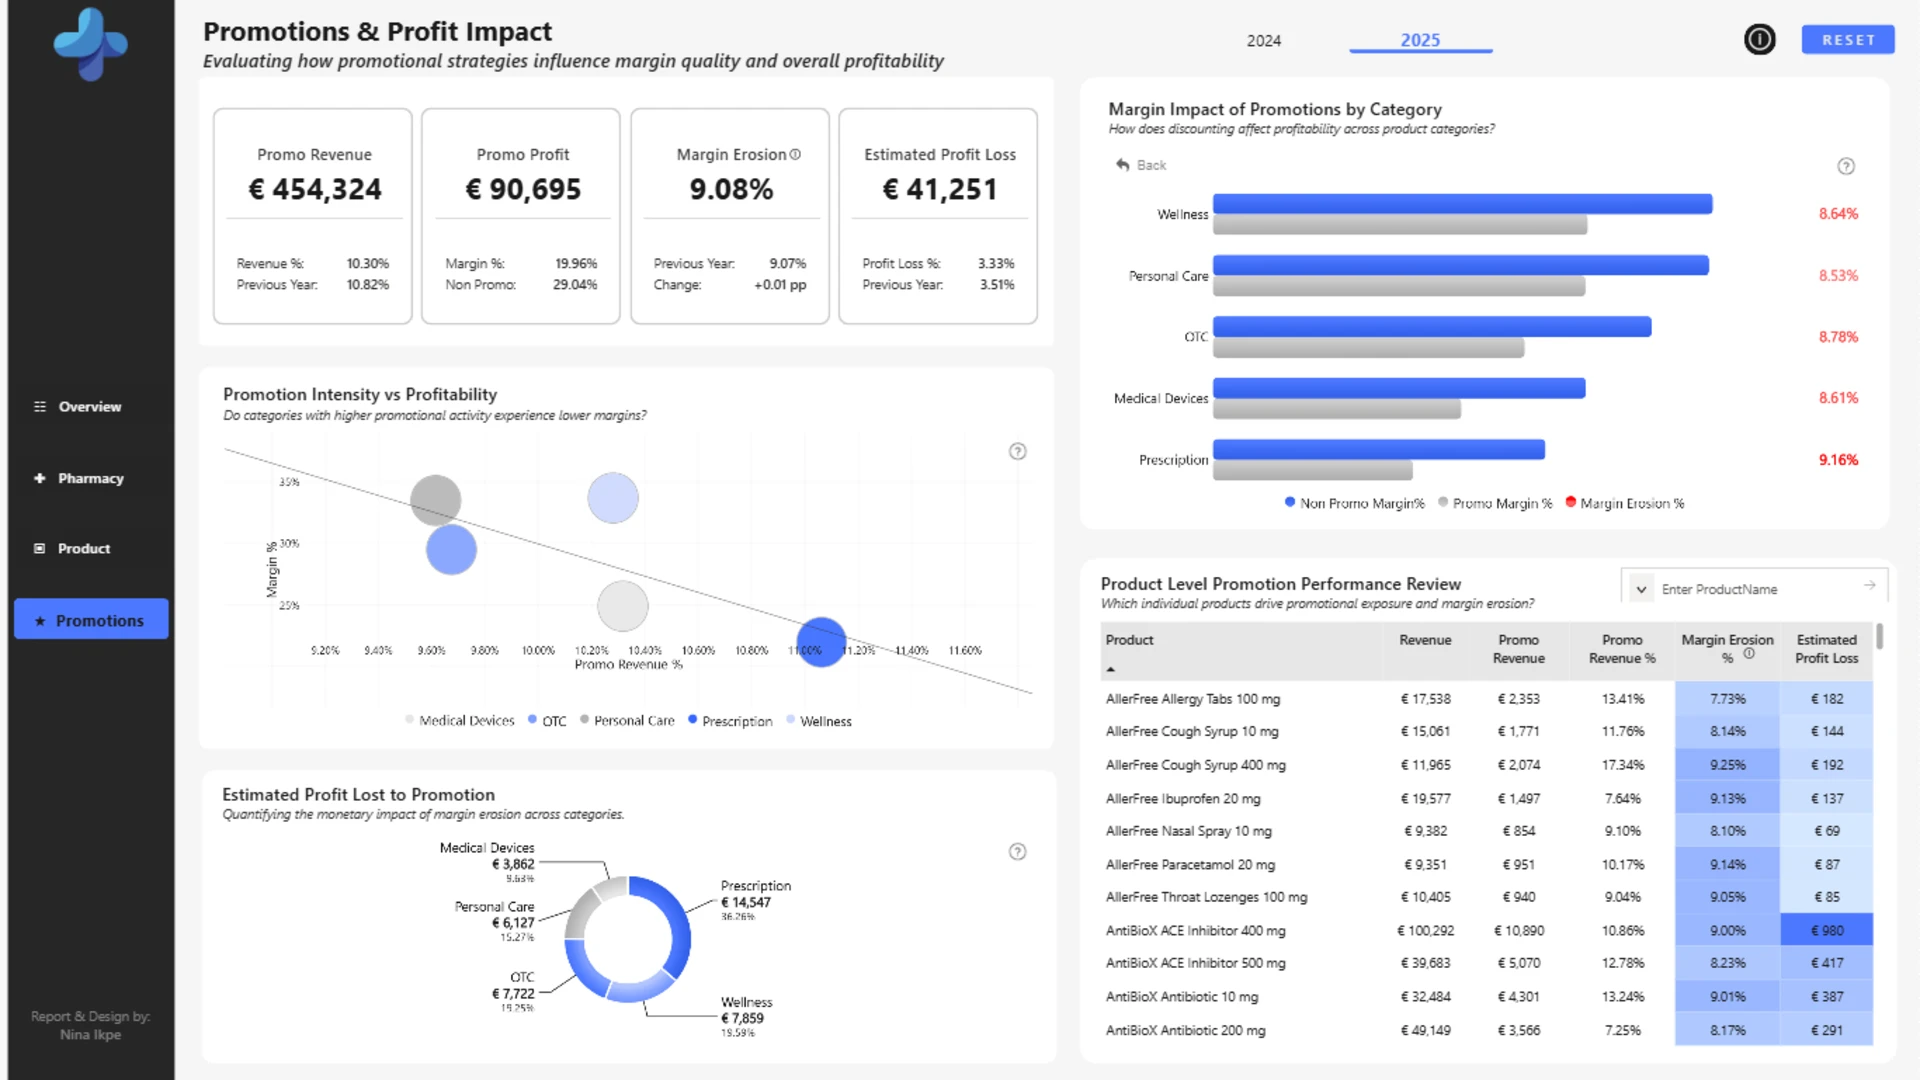
This report analyzes the performance of a pharmacy network across Europe through two key lenses: scale and sustainability. It examines not only where revenue is generated but also how efficiently it converts into profit across regions, store formats, and product categories. The analysis highlights where volume and margin align or diverge, questioning whether strong sales truly translate into sustainable profitability. A central focus is promotional margin erosion, measuring the profitability trade-off between full-price and discounted sales to determine whether promotions drive growth or erode margins. Overall, the report provides a strategic perspective on balancing revenue growth with long-term profitability.
ZoomCharts visuals used
4U Report Challenges
Participate in data challenges, build and submit reports to get free template downloads.
Join CommunityMobile view allows you to interact with the report. To Download the template please switch to desktop view.

Was this helpful? Thank you for your feedback!
Sorry about that.
How can we improve it?