851
Pharmacy Sales Power BI Dashboard 6
Pharmacy Sales Power BI Dashboard 6
More Report pages
Report Author: Abinash Nandan Jena
851
Share template with others
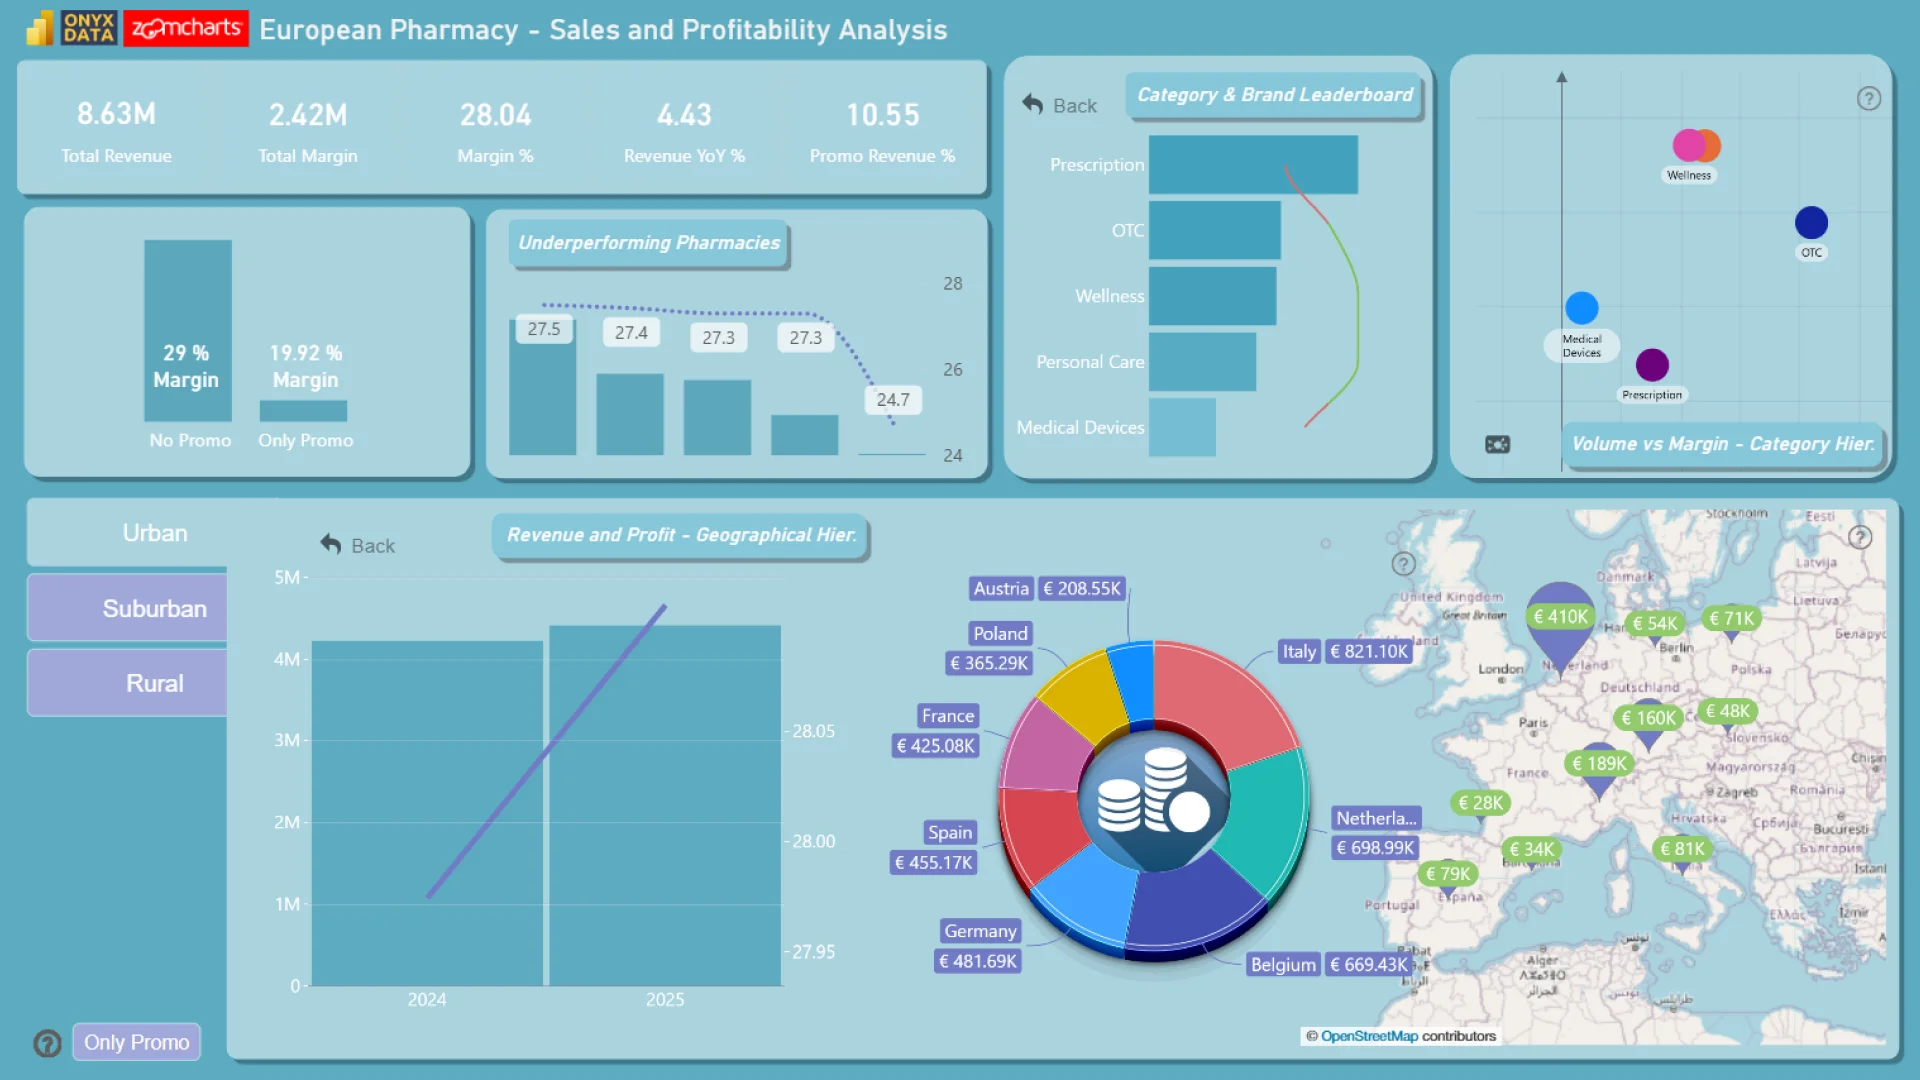
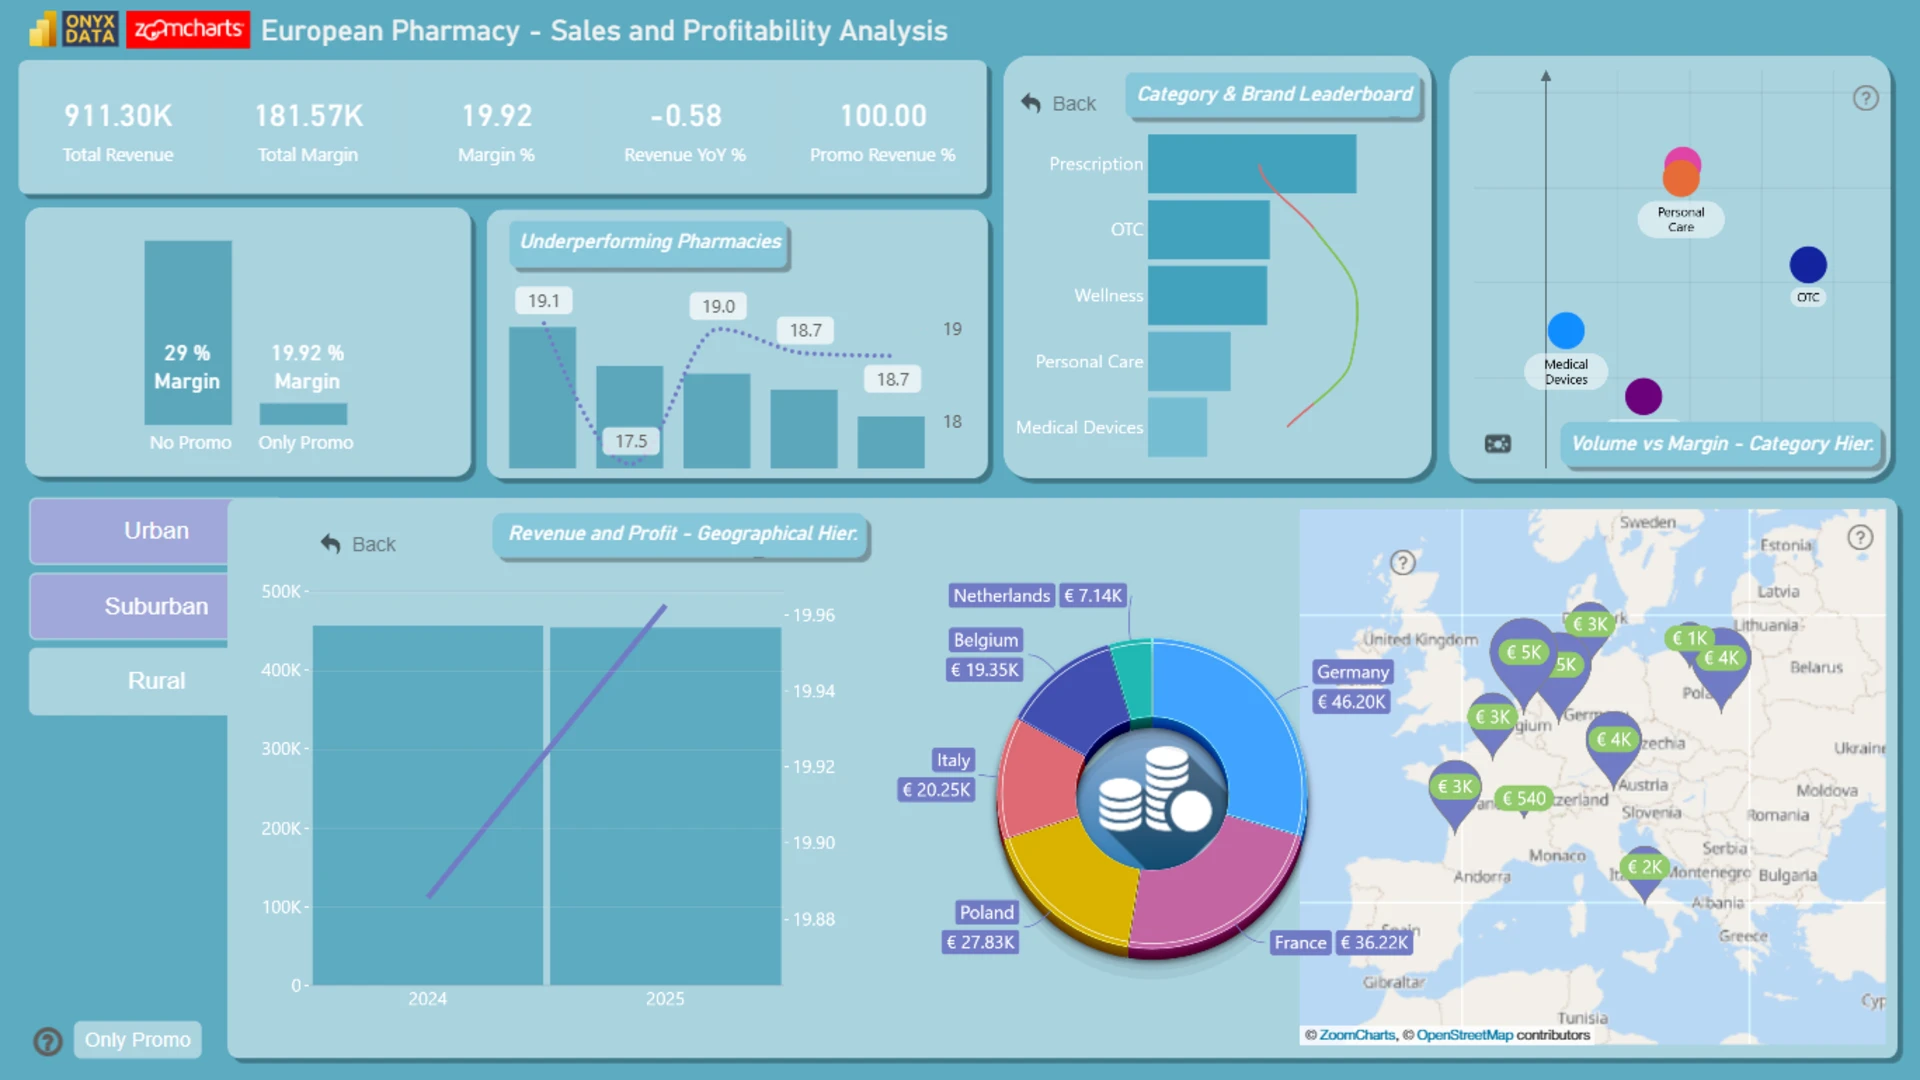
This Power BI report uses the Pharmacy Sales and Profitability dataset. The report features ZoomCharts Drill Down PRO custom visuals for Power BI. It was submitted to the Onyx Data DataDNA ZoomCharts Mini Challenge in January - February 2026.
Author’s Description:
This dashboard provides a comprehensive overview of European pharmacy sales and profitability performance. It highlights key KPIs such as total revenue, total margin, margin percentage, year-over-year growth, and promotional revenue contribution. Users can compare promotional versus non-promotional performance, identify underperforming pharmacies, and analyze category and brand performance across segments such as Prescription, OTC, Wellness, Personal Care, and Medical Devices. The dashboard also delivers geographic insights by showing revenue and profit distribution by country, supported by a map to visualize regional performance differences. Overall, it helps stakeholders monitor financial performance, evaluate promotional effectiveness, track category trends, and identify growth opportunities across markets and store segments (Urban, Suburban, and Rural).
ZoomCharts visuals used
4U Report Challenges
Participate in data challenges, build and submit reports to get free template downloads.
Join CommunityMobile view allows you to interact with the report. To Download the template please switch to desktop view.

Was this helpful? Thank you for your feedback!
Sorry about that.
How can we improve it?