590
Pharmacy Sales and Profitability Analysis 12
Pharmacy Sales and Profitability Analysis 12
Report Author: Adaobi Roseline Ezechukwu
590
Share template with others
This Power BI report uses the Pharmacy Sales and Profitability dataset. The report features ZoomCharts Drill Down PRO custom visuals for Power BI. It was submitted to the Onyx Data DataDNA ZoomCharts Mini Challenge in January - February 2026.
Author’s Description:
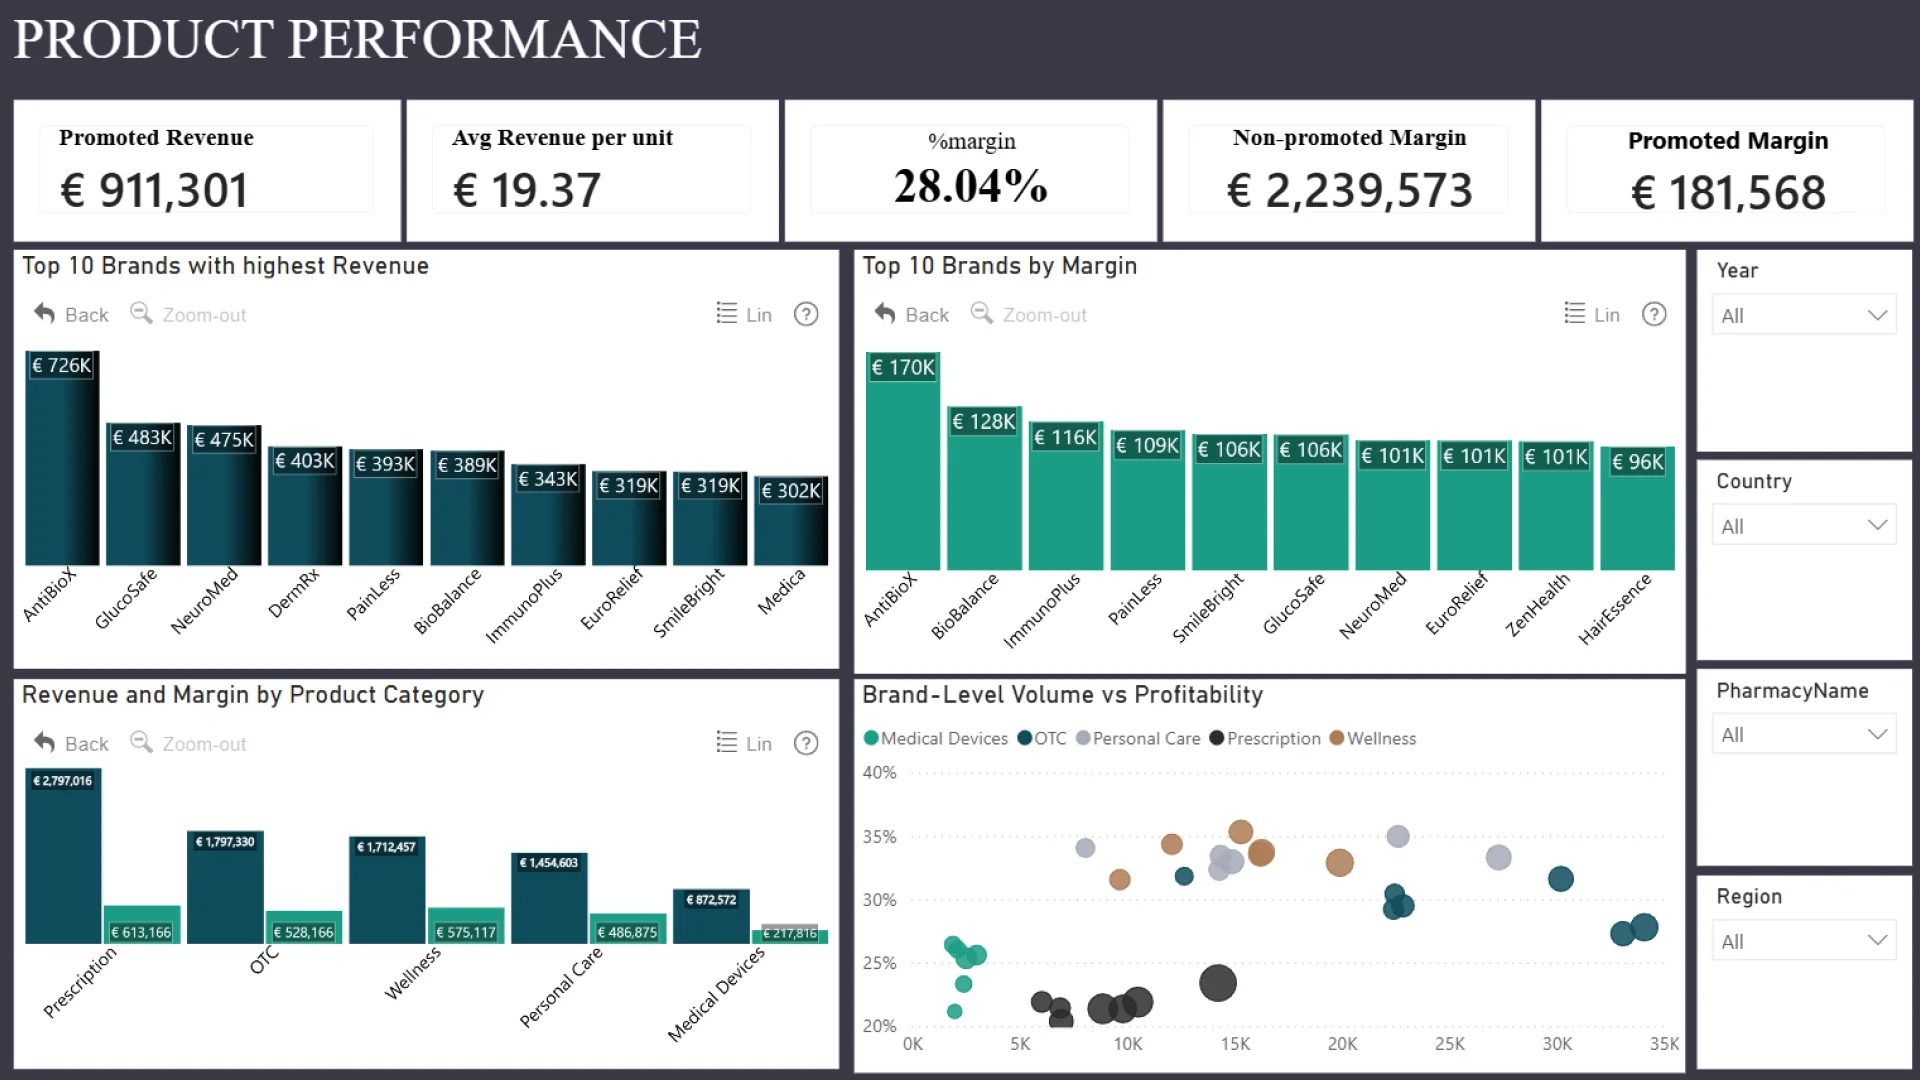
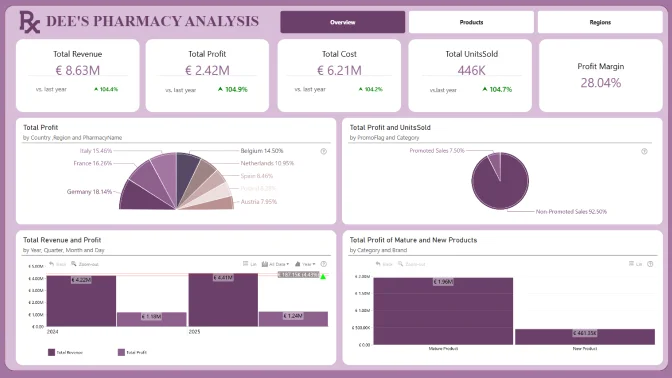
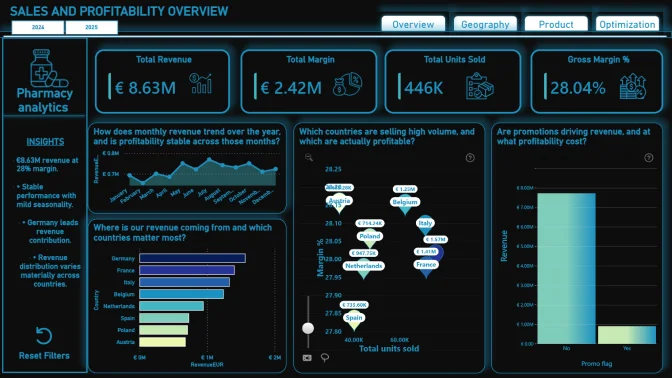
This interactive Power BI dashboard analyzes €8.63M in pharmacy sales across Europe. It highlights revenue, margin (28%), promotion impact, brand performance, and geographic trends, transforming raw data into actionable insights for strategic decision-making.
4U Report Challenges
Participate in data challenges, build and submit reports to get free template downloads.
Join CommunityMobile view allows you to interact with the report. To Download the template please switch to desktop view.

Was this helpful? Thank you for your feedback!
Sorry about that.
How can we improve it?