562
Pharma Sales Profitability Report 8
Pharma Sales Profitability Report 8
Report Author: Iman Ngwepe
562
Share template with others
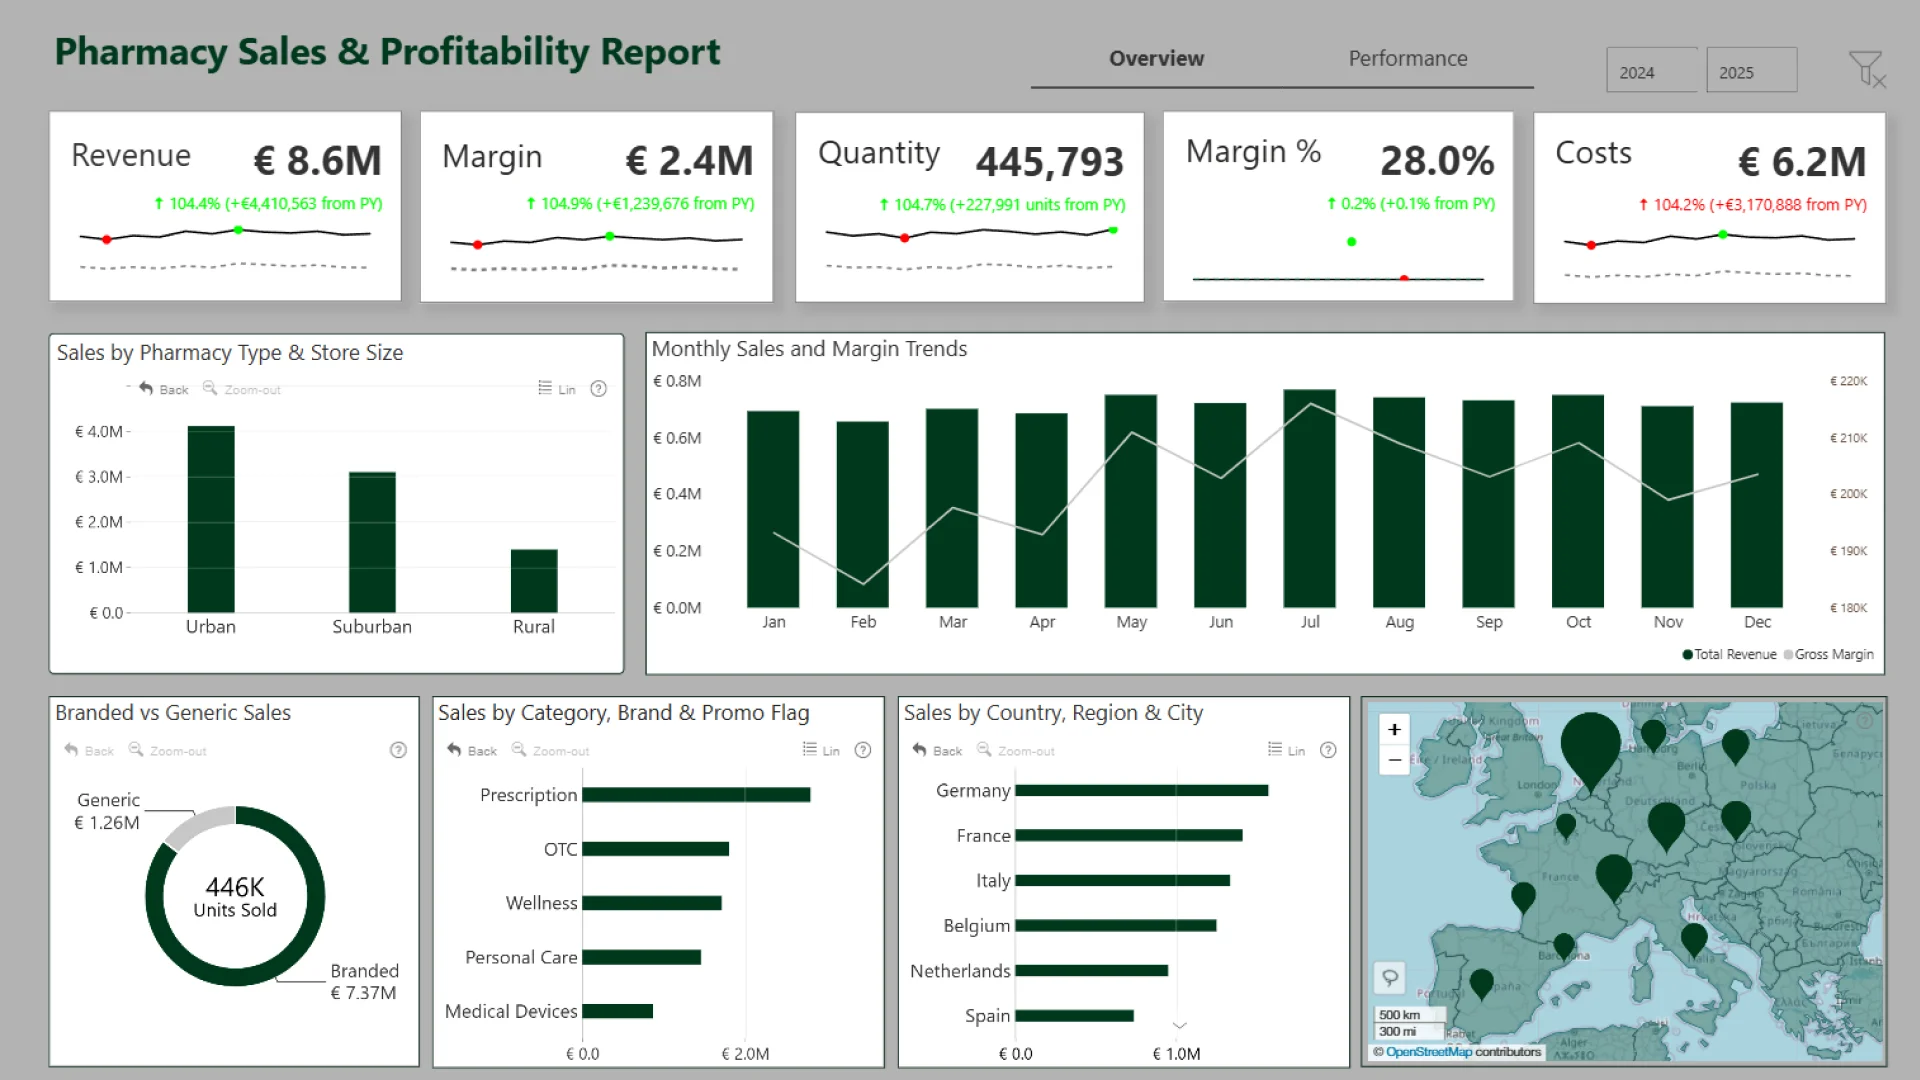
This Power BI report uses the Pharmacy Sales and Profitability dataset. The report features ZoomCharts Drill Down PRO custom visuals for Power BI. It was submitted to the Onyx Data DataDNA ZoomCharts Mini Challenge in January - February 2026.
Author’s Description:
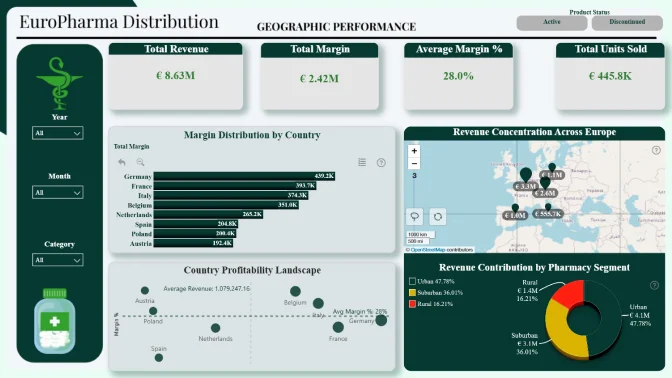
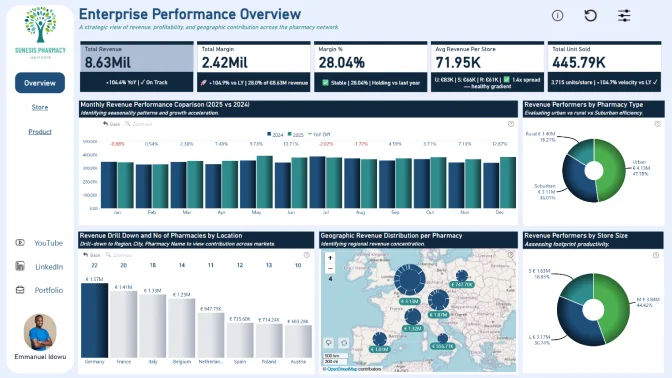
This report analyzes European pharmacy sales transactions by combining product, pharmacy, and date dimensions with revenue, cost, and margin measures. It enables the evaluation of profitability, product mix, and the impact of promotions across different geographies and store types.
ZoomCharts visuals used
4U Report Challenges
Participate in data challenges, build and submit reports to get free template downloads.
Join CommunityMobile view allows you to interact with the report. To Download the template please switch to desktop view.

Was this helpful? Thank you for your feedback!
Sorry about that.
How can we improve it?