This Power BI report uses the Pharmacy Sales and Profitability dataset. The report features ZoomCharts Drill Down PRO custom visuals for Power BI. It was submitted to the Onyx Data DataDNA ZoomCharts Mini Challenge in January - February 2026.
Author’s Description:
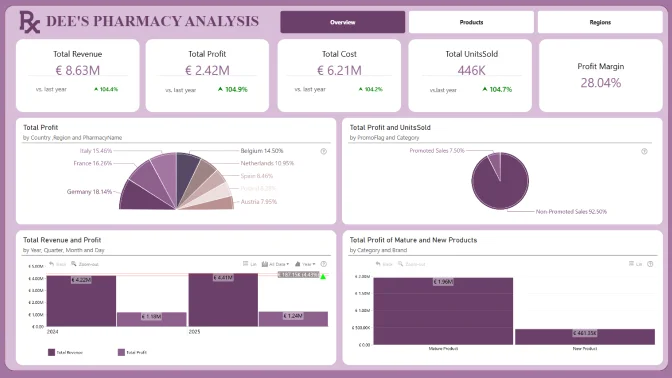
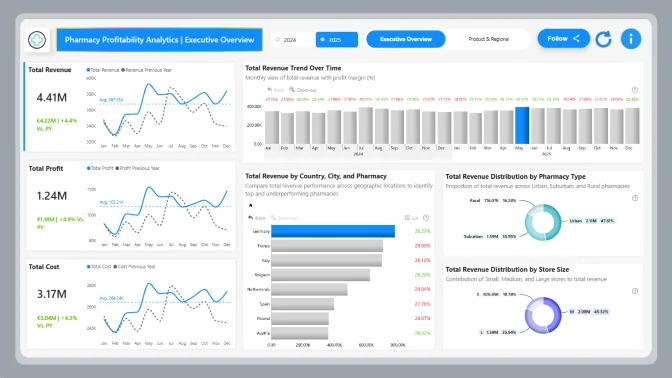
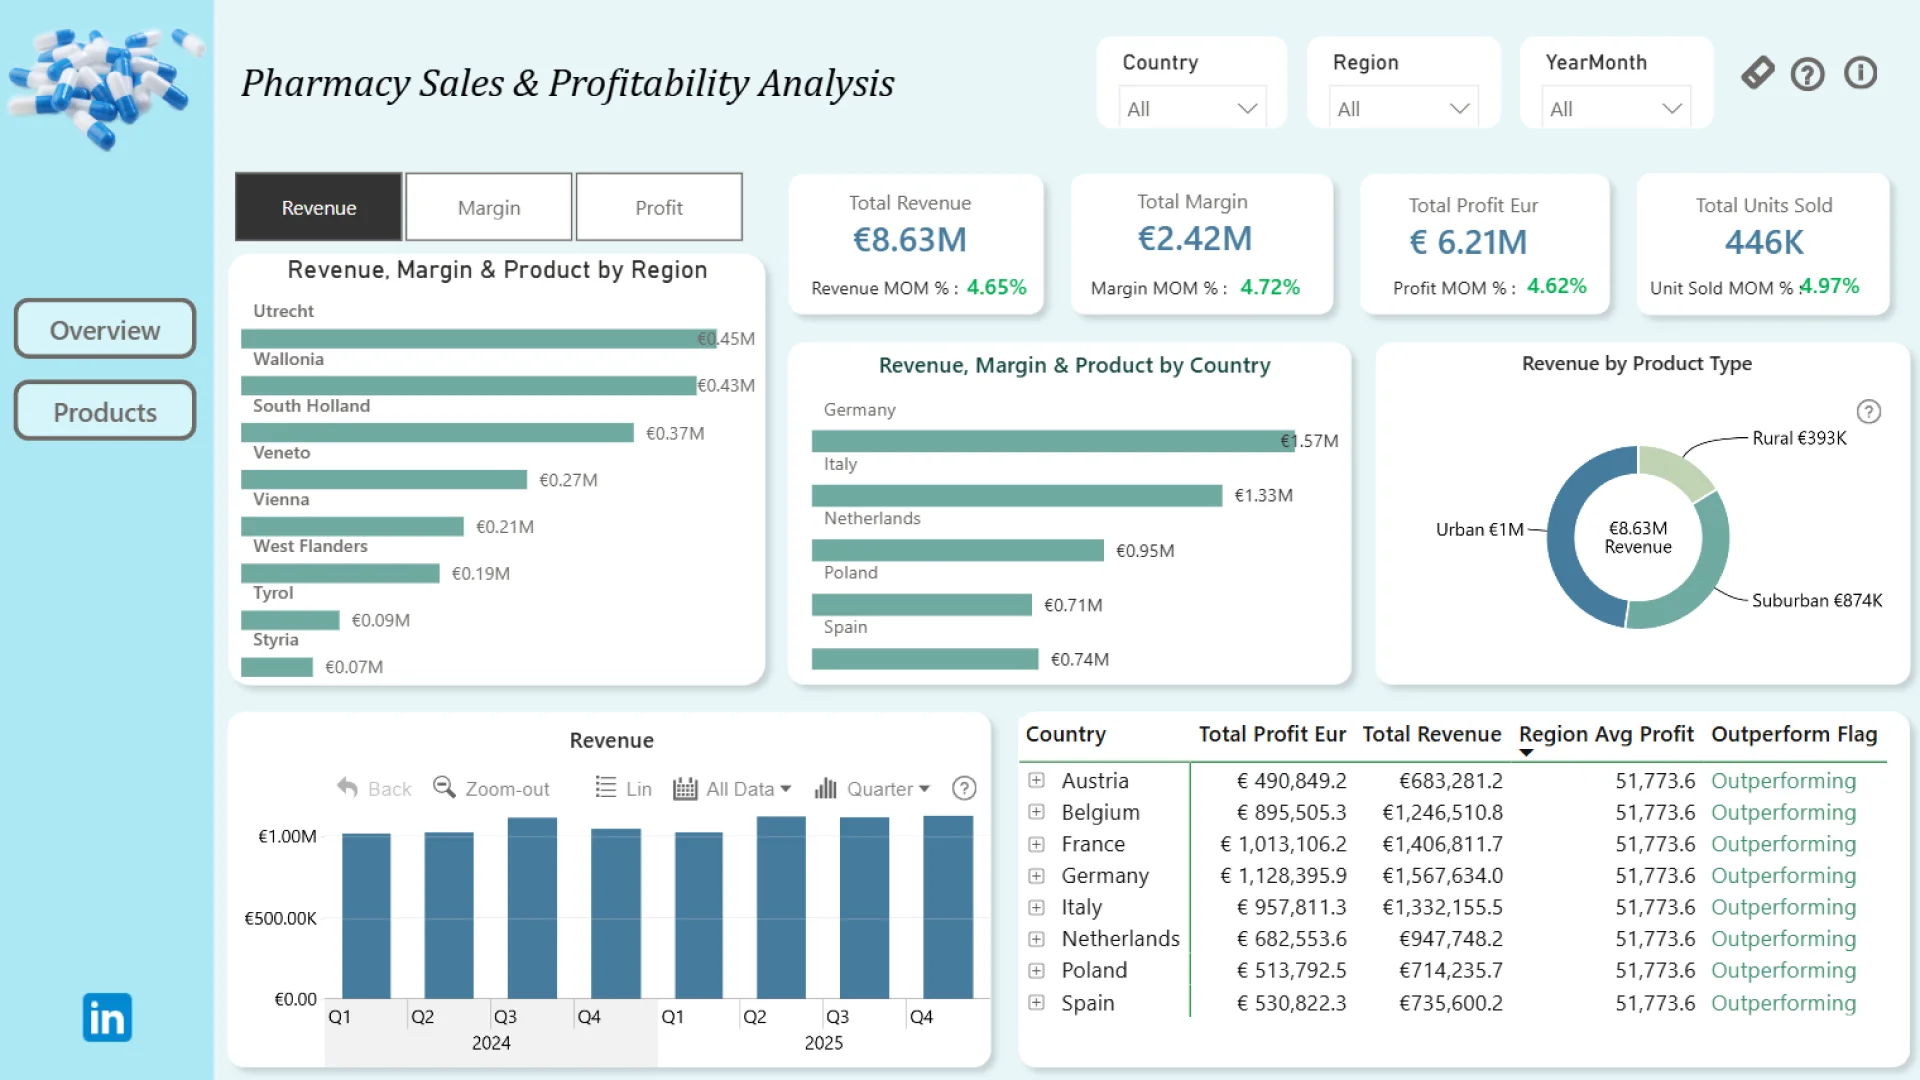
Built an interactive Power BI dashboard to analyze pharmacy sales performance, profitability, and product insights across regions. The report features dynamic metric switching (Revenue, Margin, Profit), KPI tracking, and interactive visuals to support data-driven business decisions.