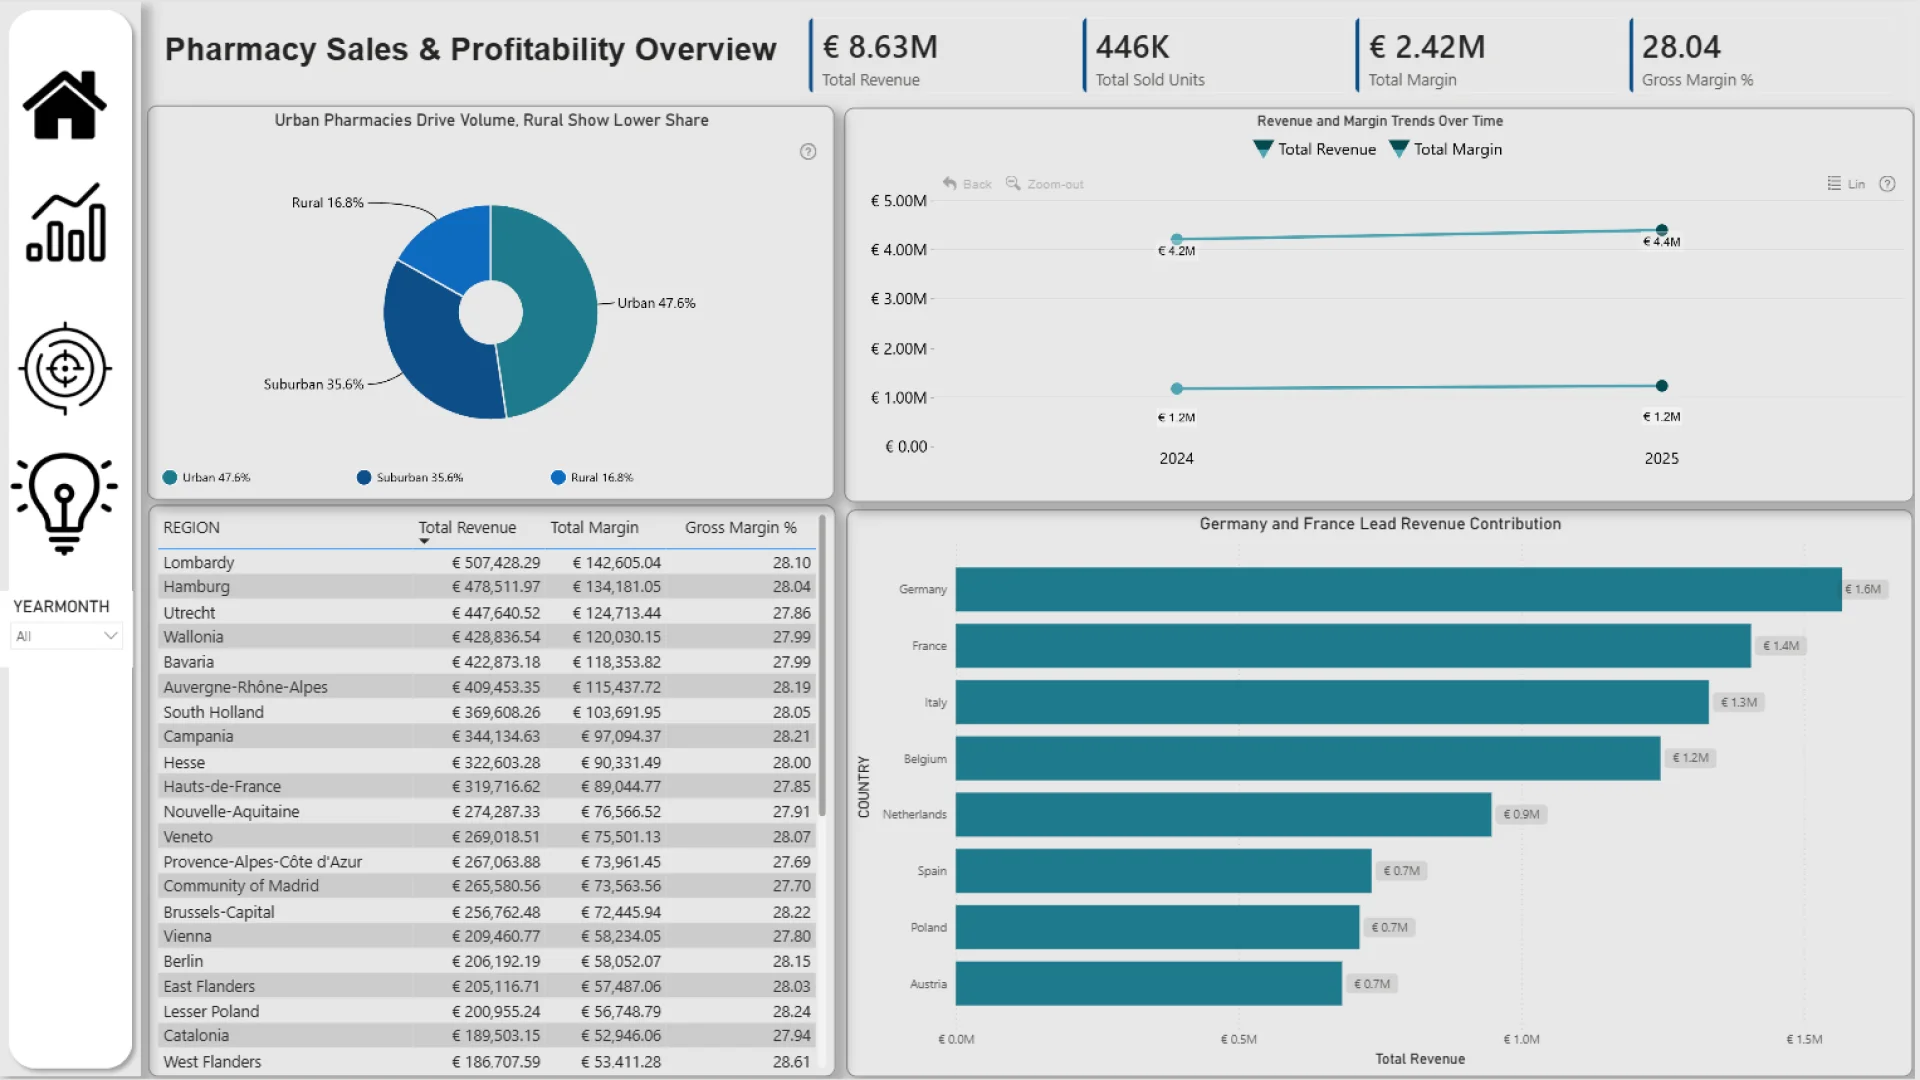
This project presents a multi-page Power BI dashboard designed to analyze sales performance and profitability across a pharmacy network. Its objective is to move beyond surface-level KPIs and address key business questions related to geography, product mix, pharmacy performance, and promotion strategy through a structured, business-focused storytelling approach. The dashboard consists of four pages covering sales and profitability overview, product and brand performance, promotion impact analysis, and executive insights. The analysis shows stable revenue and margin growth, significant geographic concentration of performance, strong variation at the pharmacy level, and clear trade-offs between sales volume and profitability. It also highlights that promoted sales tend to generate lower value per unit, while non-promoted sales demonstrate stronger pricing power and revenue efficiency.
588
Pharma Sales Power BI Report 3
Pharma Sales Power BI Report 3
Report Author: Amit Mishra
588
Share template with others
This Power BI report uses the Pharmacy Sales and Profitability dataset. The report features ZoomCharts Drill Down PRO custom visuals for Power BI. It was submitted to the Onyx Data DataDNA ZoomCharts Mini Challenge in January - February 2026.
Author’s Description:
4U Report Challenges
Participate in data challenges, build and submit reports to get free template downloads.
Join CommunityMobile view allows you to interact with the report. To Download the template please switch to desktop view.


Was this helpful? Thank you for your feedback!
Sorry about that.
How can we improve it?