805
Pharma Sales Power BI Dashboard 8
Pharma Sales Power BI Dashboard 8
More Report pages
Report Author: Oyekunle Oyelude
805
Share template with others
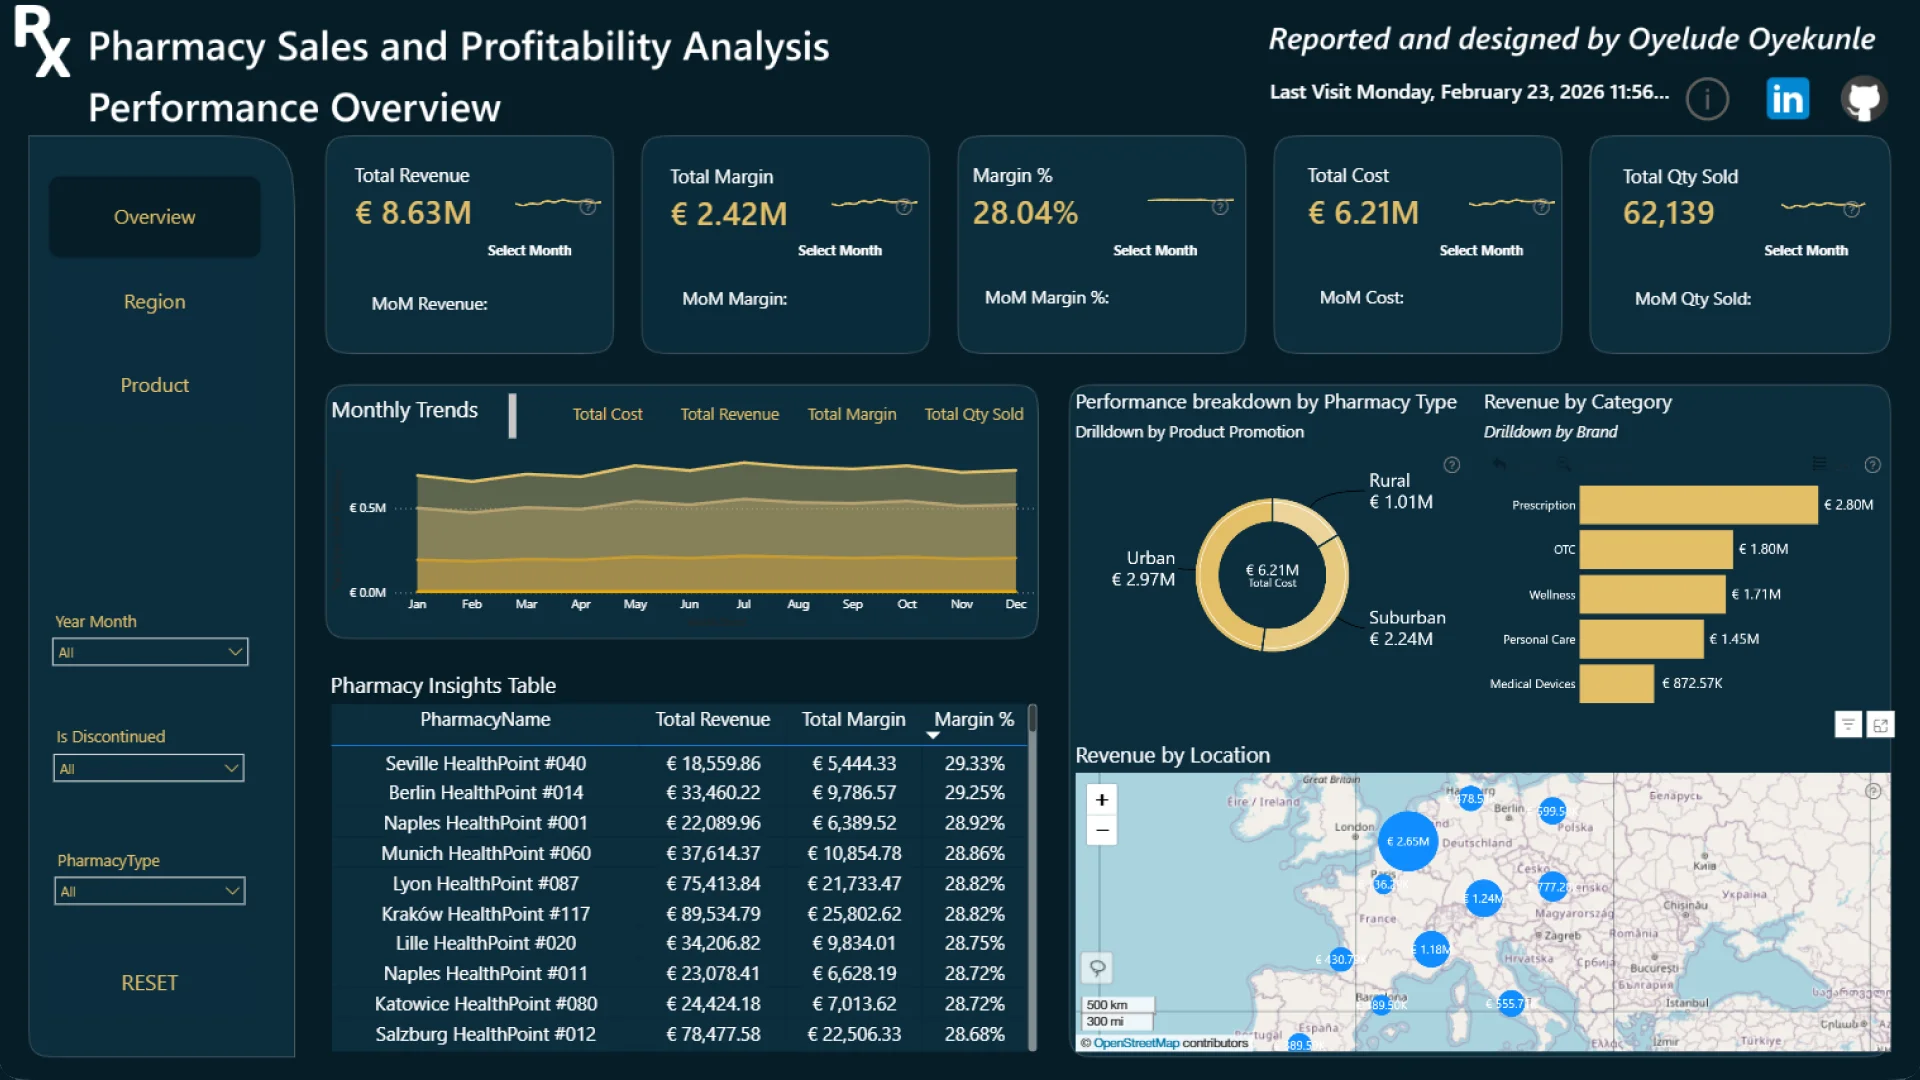
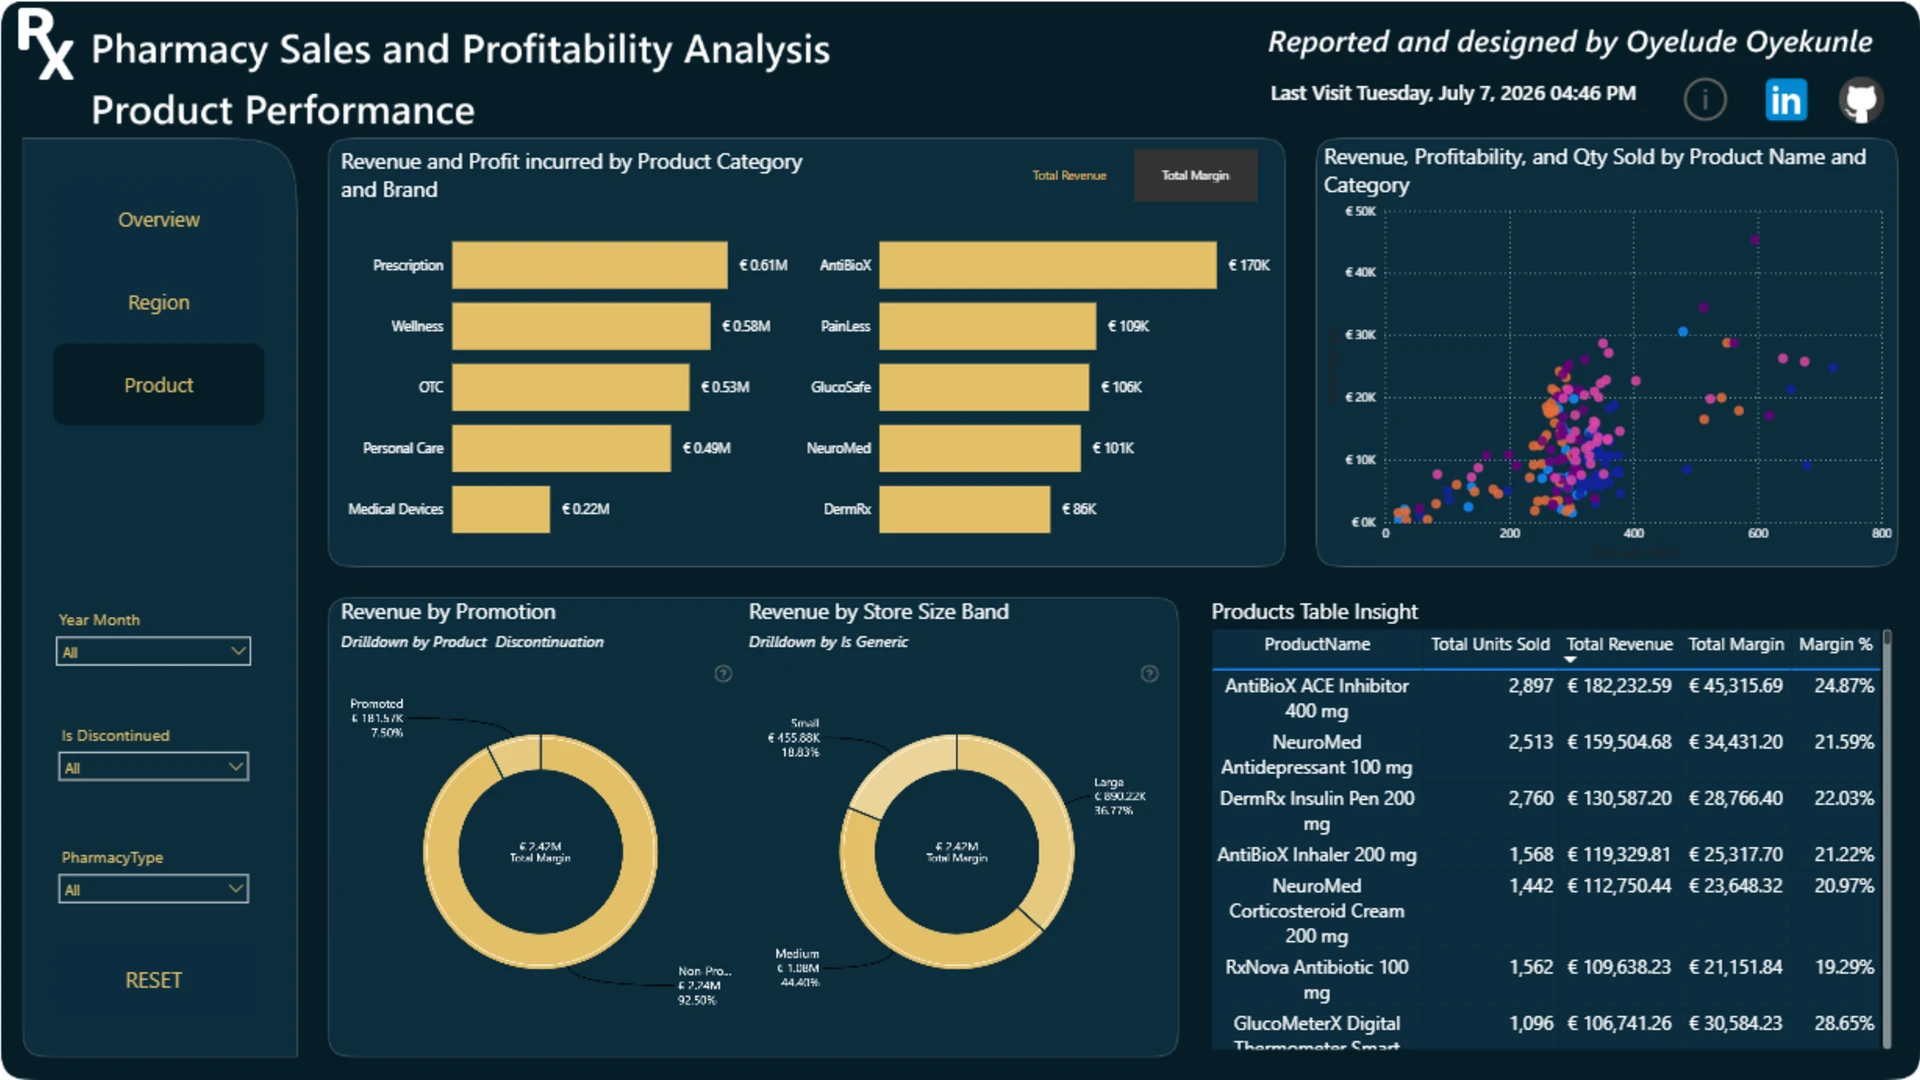
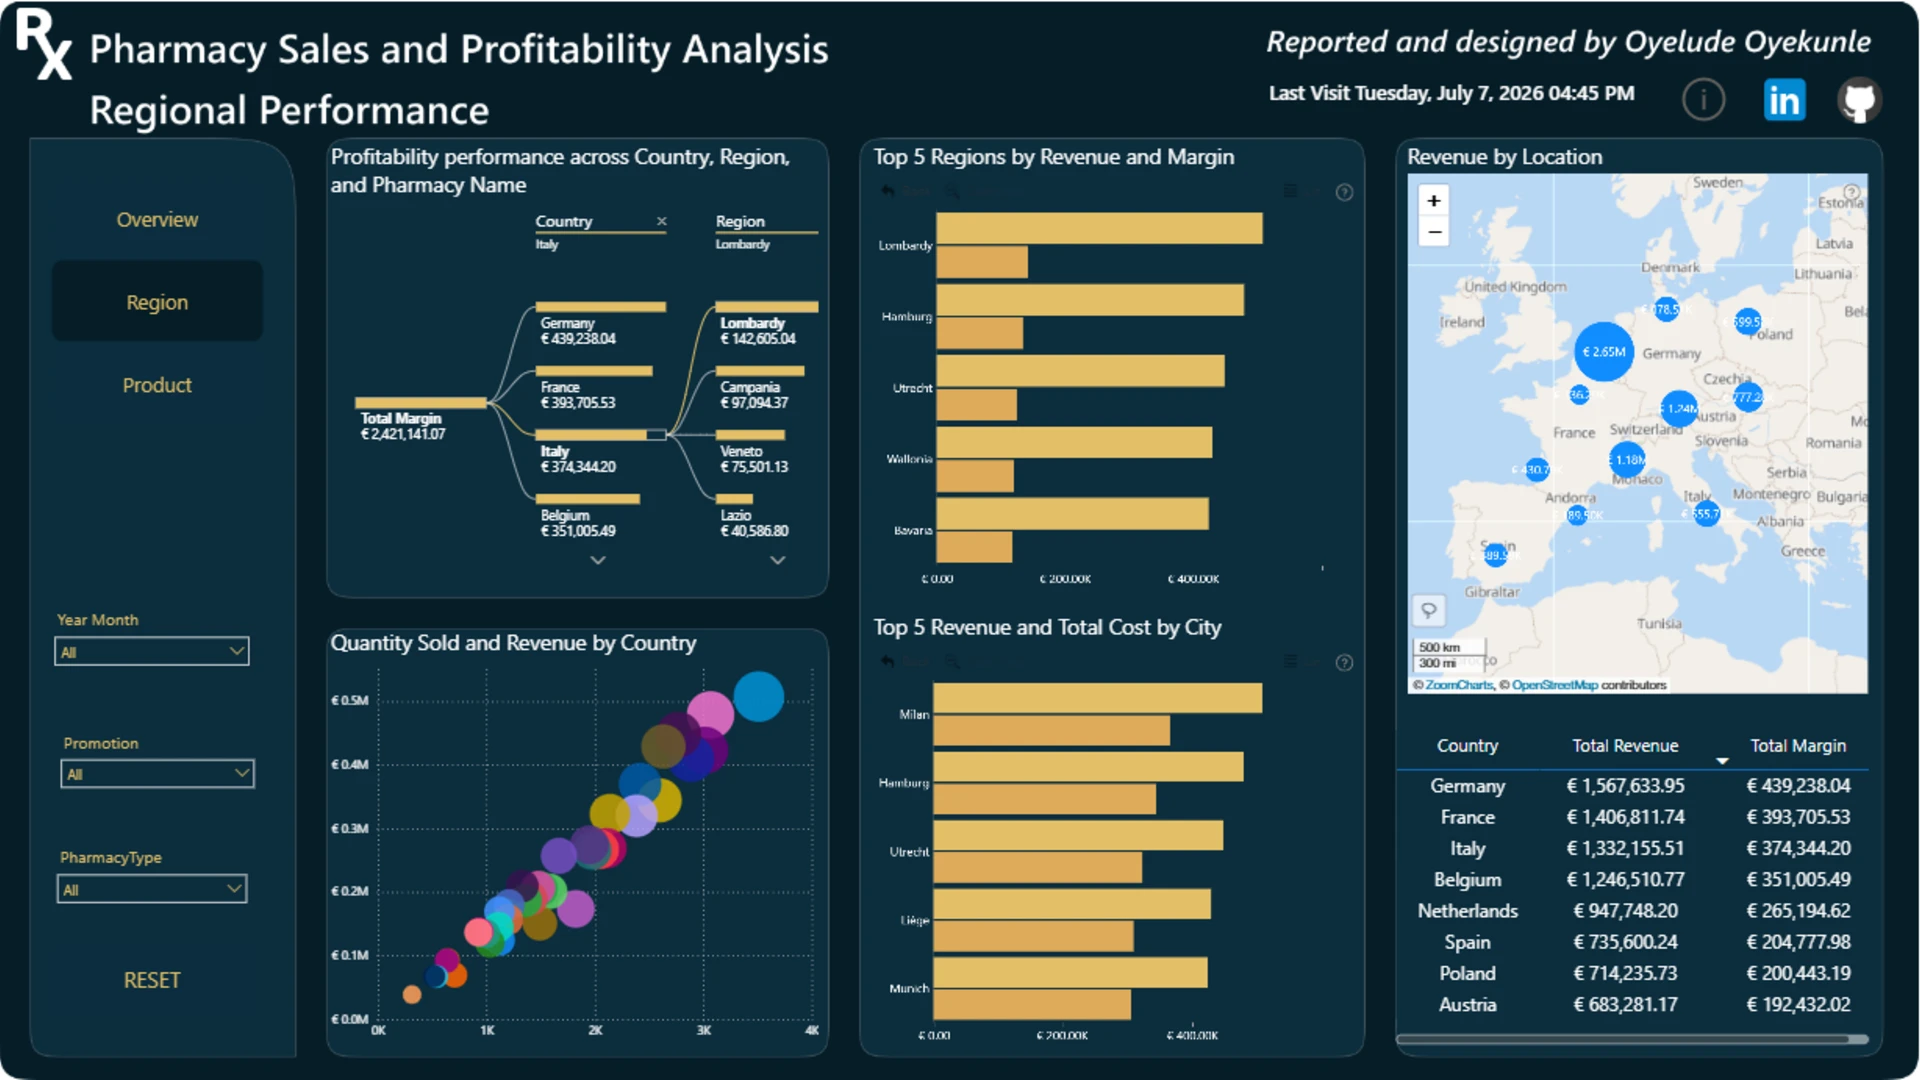
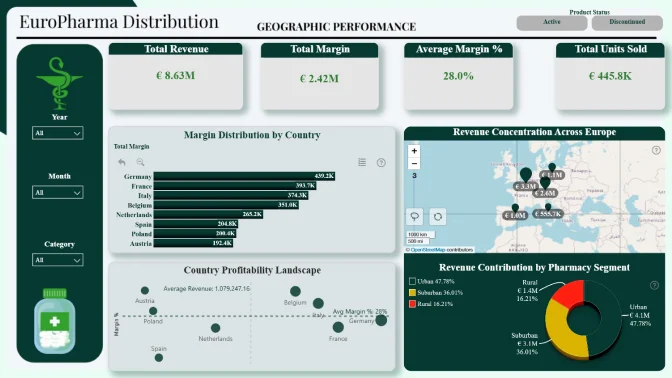
This Power BI report uses the Pharmacy Sales and Profitability dataset. The report features ZoomCharts Drill Down PRO custom visuals for Power BI. It was submitted to the Onyx Data DataDNA ZoomCharts Mini Challenge in January - February 2026.
Author’s Description:
This project focused on understanding revenue drivers, cost structures, and profitability patterns across pharmacies, regions, product categories, and brands using Power BI, DAX, and Power Query.
ZoomCharts visuals used
4U Report Challenges
Participate in data challenges, build and submit reports to get free template downloads.
Join CommunityMobile view allows you to interact with the report. To Download the template please switch to desktop view.
Was this helpful? Thank you for your feedback!
Sorry about that.
How can we improve it?