541
Performance Analytics
Performance Analytics
Report Author: Abhilasha Narasimhan
541
Share template with others
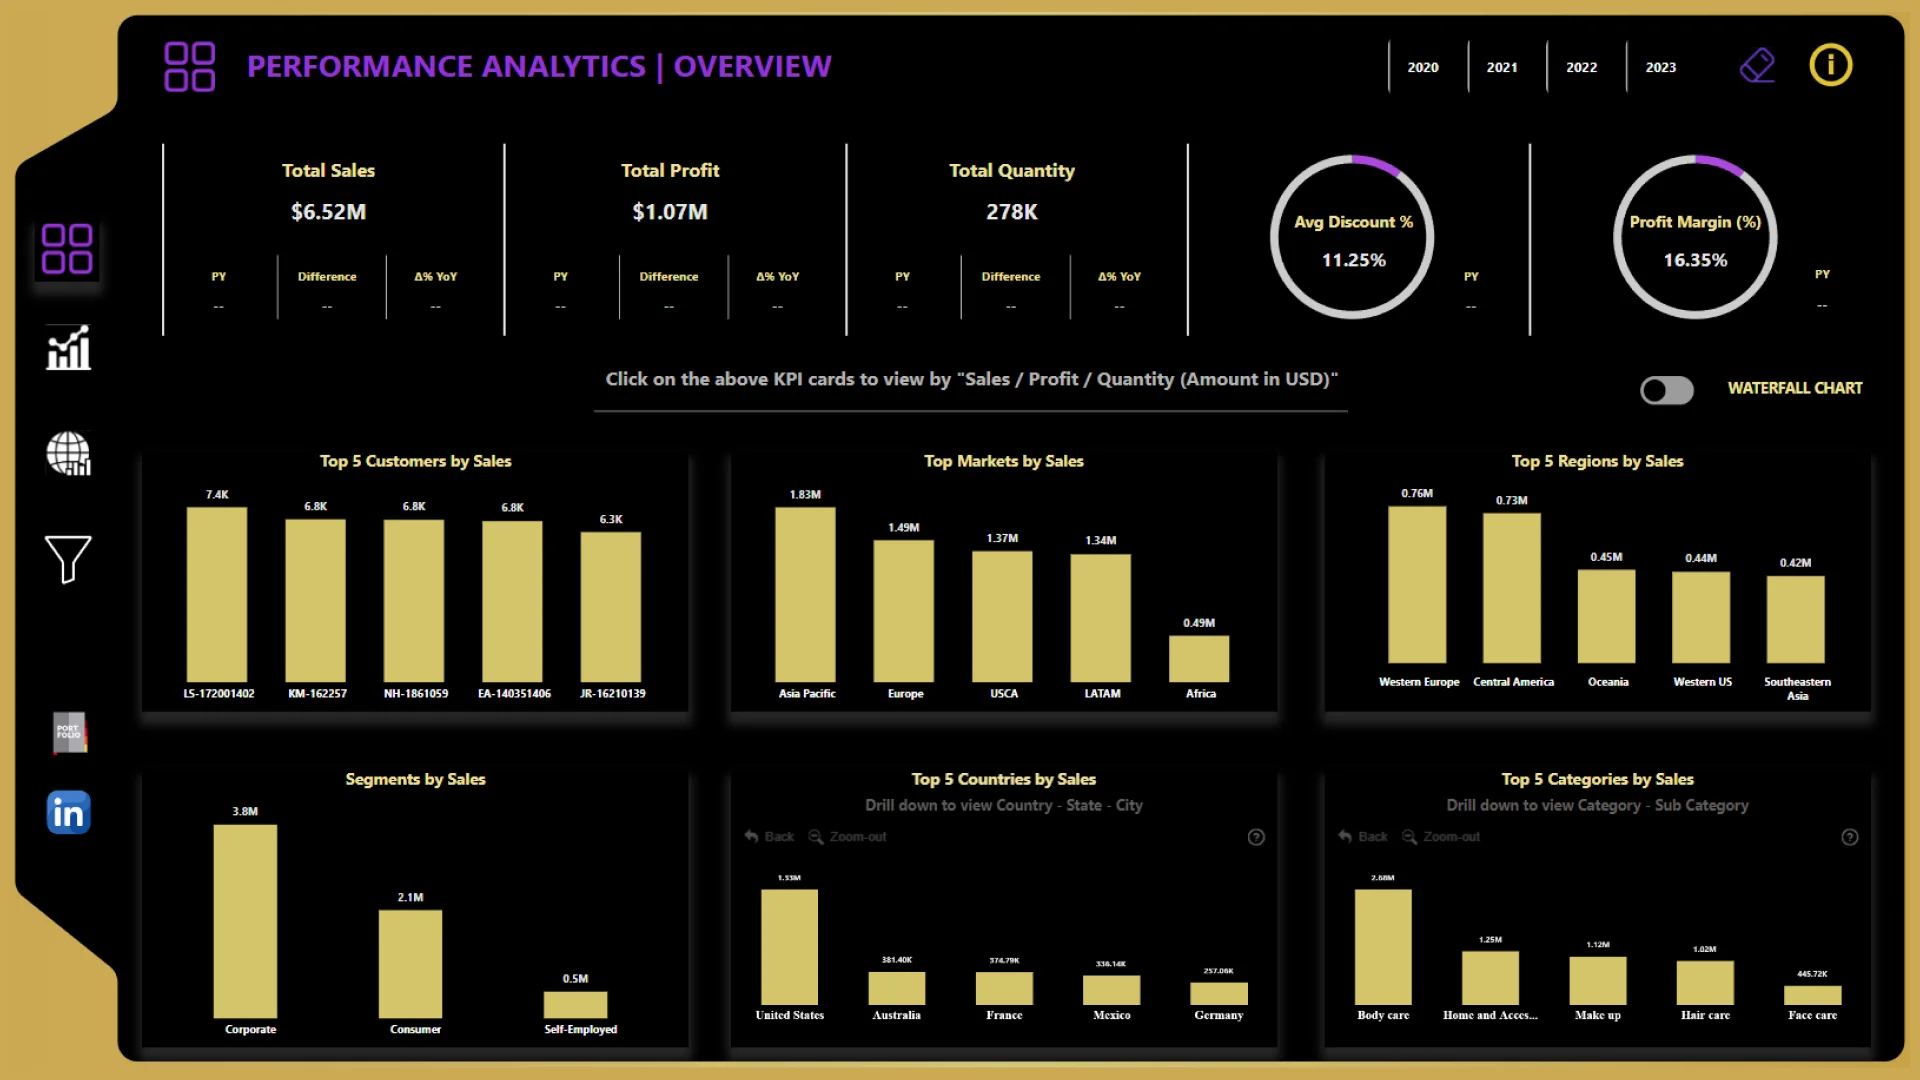
Report submitted for FP20 Analytics ZoomCharts Challenge 19 (September 2024). The report was built with the E-commerce KPI Analysis dataset and includes ZoomCharts custom Drill Down PRO visuals for Power BI.
Author's description:
This is an interactive dashboard created for a global skincare and beauty e-store. The dashboard will help analyze sales, profitability, and discounts across various product categories, markets, and customer segments, enabling key stakeholders to track performance against targets and make informed strategic decisions.
It will also include interactive features for "What-If" analysis, allowing users to assess the impact of applying different discount rates or growth scenarios on sales and profits.
4U Report Challenges
Participate in data challenges, build and submit reports to get free template downloads.
Join CommunityMobile view allows you to interact with the report. To Download the template please switch to desktop view.

Was this helpful? Thank you for your feedback!
Sorry about that.
How can we improve it?