869
Paralympics Data set ZoomCharts
Paralympics Data set ZoomCharts
Report Author: Sounak Paul
869
Share template with others
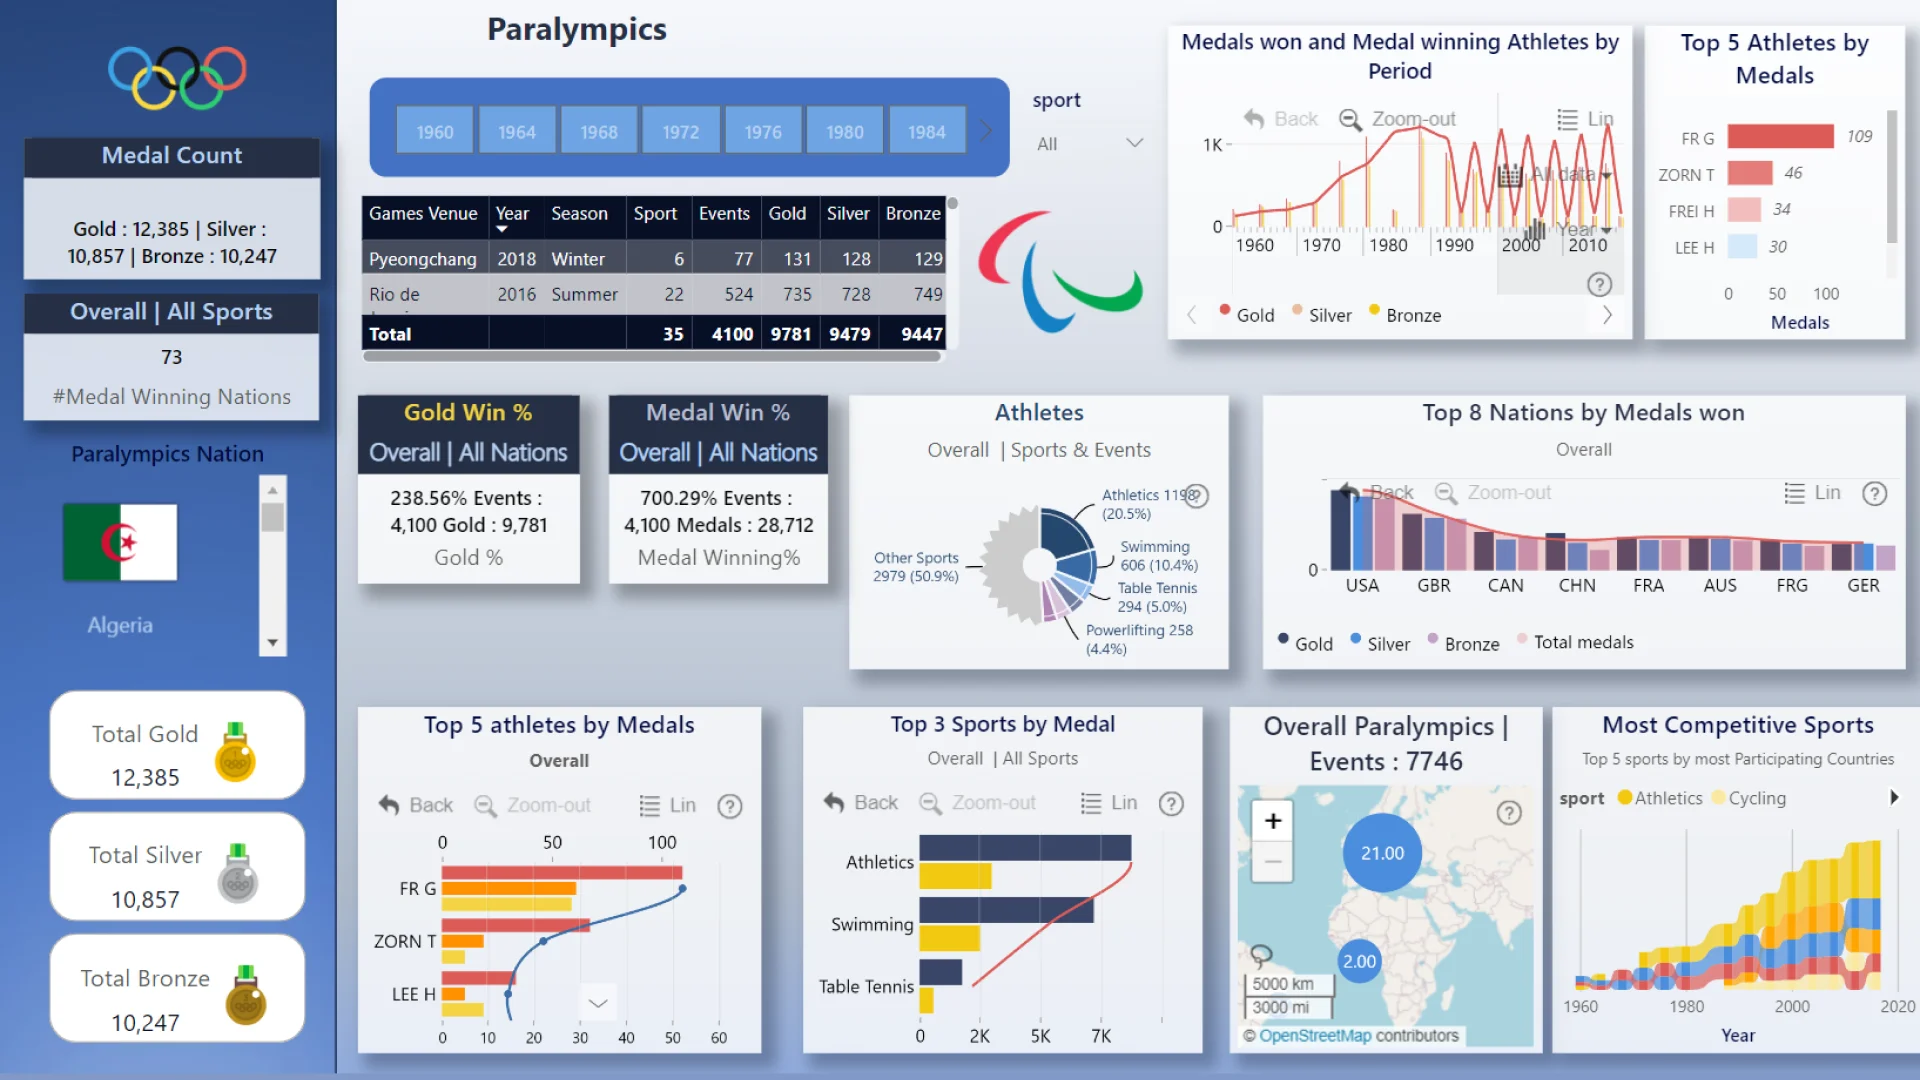
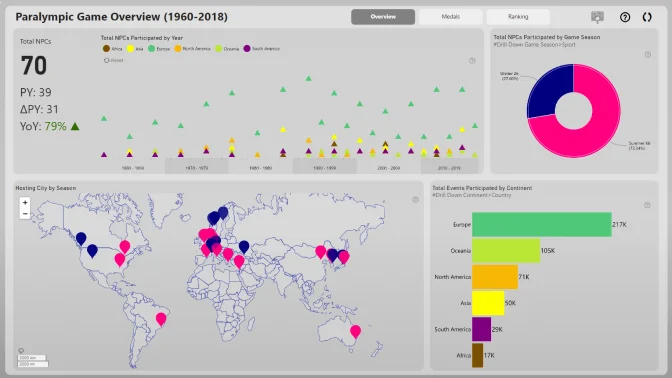
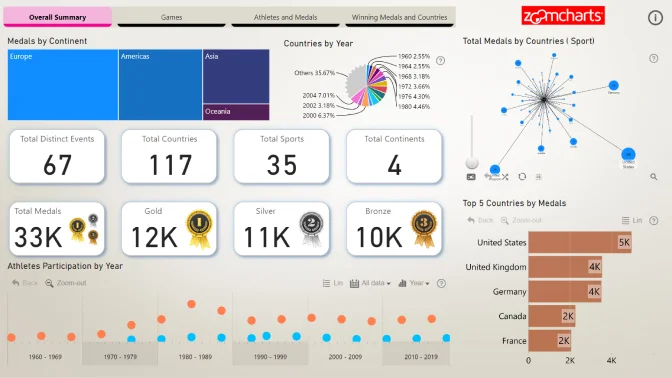
Report submitted for Onyx Data DataDNA ZoomCharts Mini Challenge, September 2024. The report was built based on Paralympic Games dataset and includes ZoomCharts custom Drill Down PRO visuals for Power BI.
Author's description:
This interactive dashboard showcases Olympic data from 1968 to 2018, offering a detailed analysis of medal counts, top athletes, and leading nations. Designed for an intuitive user experience, it allows users to drill down by year and sport to uncover trends and performance insights.
The dynamic side panel provides quick access to essential metrics, ensuring a comprehensive understanding of the games' history. Perfect for competitive analysis, this dashboard merges data precision with visual clarity, making it a powerful tool for uncovering the stories behind the numbers.
ZoomCharts visuals used
4U Report Challenges
Participate in data challenges, build and submit reports to get free template downloads.
Join CommunityMobile view allows you to interact with the report. To Download the template please switch to desktop view.
Was this helpful? Thank you for your feedback!
Sorry about that.
How can we improve it?