465
Onyx Technical Support by Balu Chelluri
Share template with others
Report submitted for Onyx Data DataDNA ZoomCharts Mini Challenge, May 2024. The report was built based on Tech Support Analysis dataset and includes ZoomCharts custom Drill Down PRO visuals for Power BI.
Author's description:
Process:
To start the process, I imported the data into Power BI and performed data transformation in Power Query. There were a few anomalies found in first response time and resolution time. To minimize errors, I excluded them from KPIs and created a data model in Power BI. To understand the correlation between survey results and KPIs, I used Python. However, no correlation was found, so I excluded that part from this analysis.
Constraints:
Due to limited data and few closed status tickets, along with no survey results for many resolved tickets, I attempted to consider both "closed" and "resolved" tickets as solved tickets instead on "closed" tickets.
KPI's Solved tickets:
The total number of tickets resolved or closed by agents.
Solved Rate:
Number of tickets solved by agents to total created tickets.
Solved Rate on Time:
Number of tickets solved by agents within SLA Resolution to total created tickets.
SLA Compliance:
Number of tickets solved by agents within SLA Resolution to Solved Tickets.
Survey Results:
The average score of survey results after the tickets are solved.
First Response Time (FRT):
The average time taken by agents to respond to the first interaction with a customer after a ticket is raised. Formula: Total time taken to respond to the first interaction / Number of tickets.
Resolution Time (RT):
The average time taken to resolve a ticket when it is raised.
Formula:
Total time taken to resolve tickets / Number of tickets resolved. Agent Interactions: The average number of interactions taken by agents to Solve the tickets.
Dashboard:
The dashboard contains 3 pages. I have designed this dashboard considering refreshes at the hourly level.
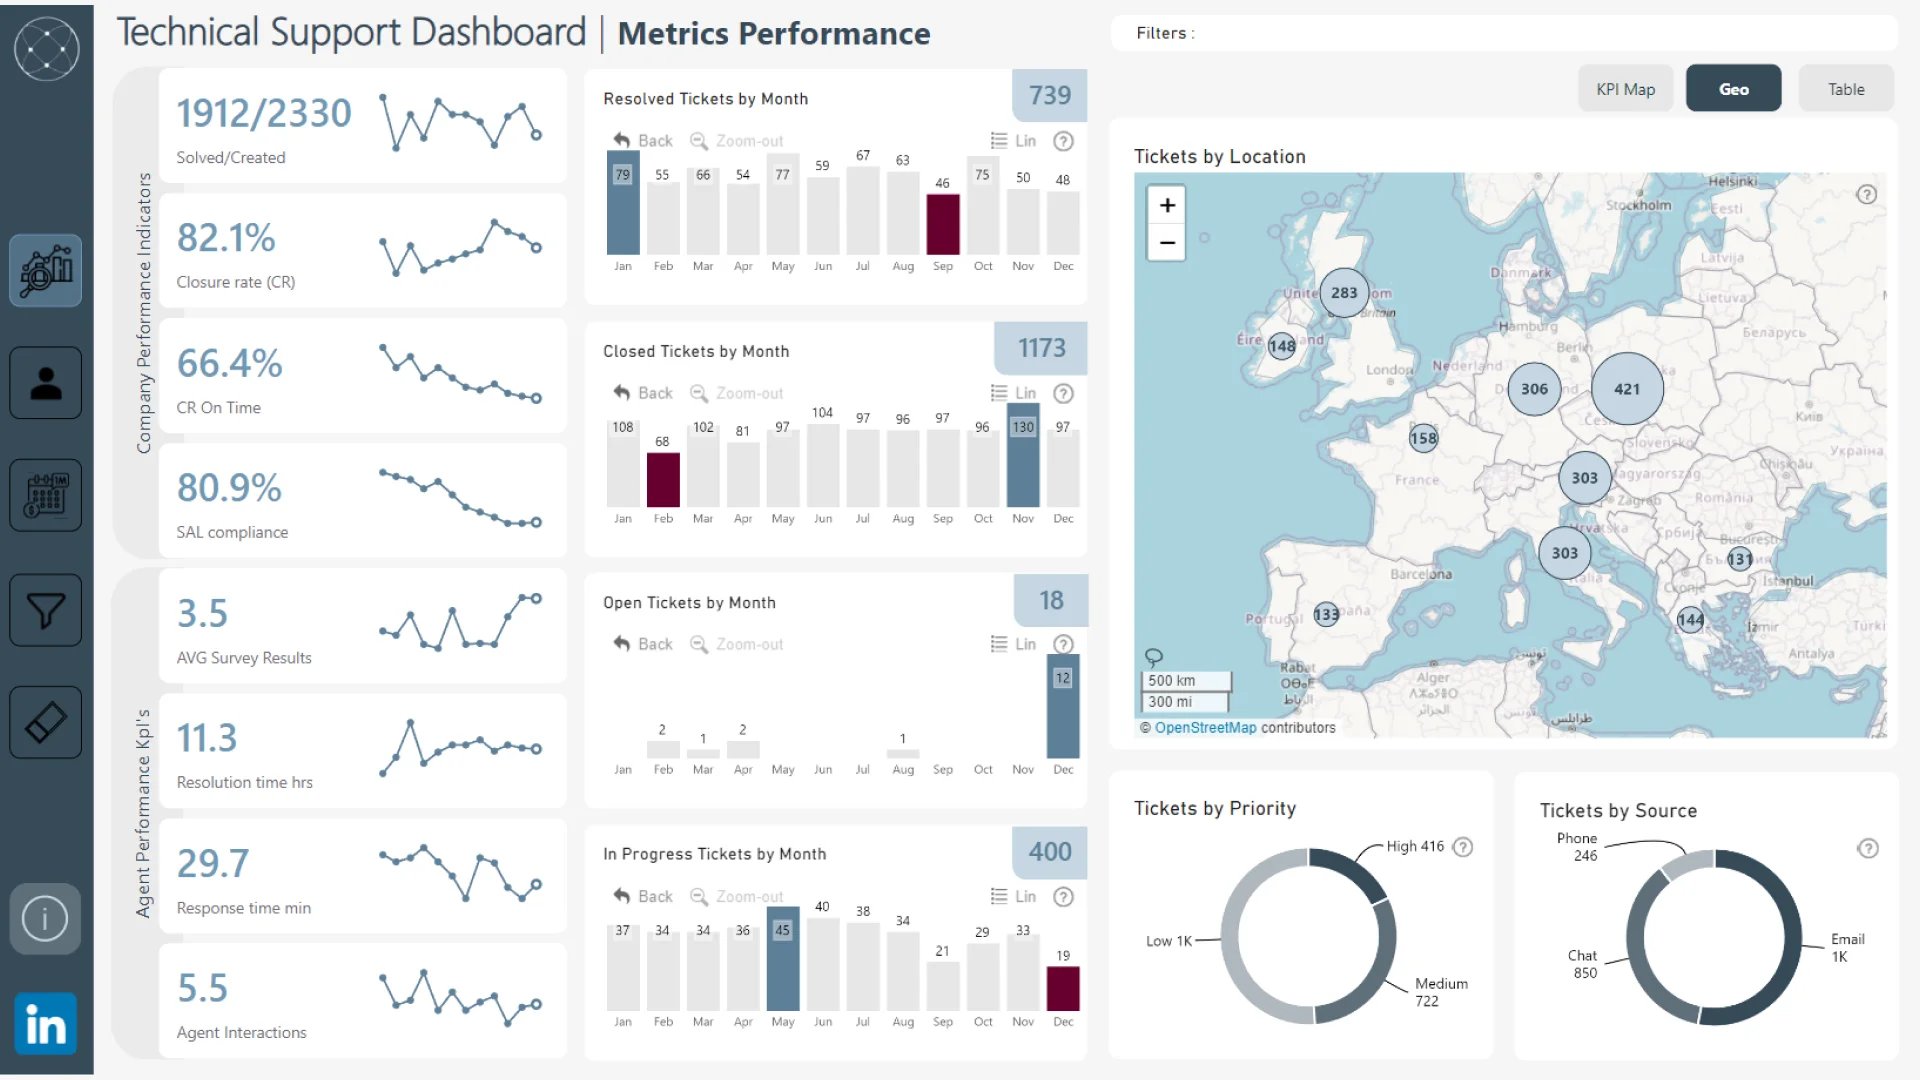
Metrics Page:
The Metrics page provides information about KPI overall performance and trends, ticket details with status, priority source, and categories.
Agent Page:
The Agent page provides KPI details along with previous month details, agent performance along with KPIs. It also includes dynamically formatted survey analysis by different categories, which helps us understand the agents' strong and weak performances.
Daily Page:
The Daily Page provides KPI details along with previous month details and ticket status from monthly to weekly to daily to hourly levels.
Agent Ranking:
To assess agent performance, I have used a custom DAX formula for agent ranking based on performance metrics.
Ranking = -- Rank based on ticket priority, survey result, closure rate on time -- RANKX( ALL(Fact_Technical_Support_Analysis[Agent Name]), [Points by priority]*[AVG Survey Results]*[SAL compliance]*[Solved rate On Time], ,DESC, Dense ) Points by priority = SUMX ( VALUES (Fact_Technical_Support_Analysis[Agent Name]), -- Iterate over each unique person VAR TotalHigh = CALCULATE ([Tickets based on Resolved date], Fact_Technical_Support_Analysis[Priority]= "High") VAR TotalMedium = CALCULATE ([Tickets based on Resolved date], Fact_Technical_Support_Analysis[Priority]= "Medium") VAR TotalLow = CALCULATE ([Tickets based on Resolved date], Fact_Technical_Support_Analysis[Priority]= "Low") RETURN (TotalHigh * 2) + (TotalMedium * 1.5) + TotalLow -- Calculate the Points )
ZoomCharts visuals used
Need help?
Send your question to ZoomCharts assistant, and we will respond to you as soon as possible.
Contact UsMobile view allows you to interact with the report. To Download the template please switch to desktop view.

ZoomCharts Academy
Learn ZoomCharts with experts and become certified!
Go to Academy!
Was this helpful? Thank you for your feedback!
Sorry about that.
How can we improve it?